![]() To view this press release as a Word document
To view this press release as a Word document
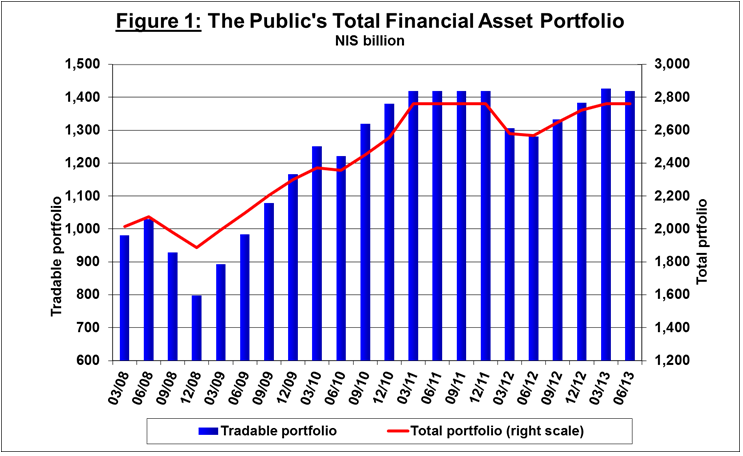
§ In the second quarter of 2013 the value of the public's financial assets portfolio declined by about 1.2 percent in real terms, and reached NIS 2.76 trillion at the end of June.
§ Most of the decline was registered in the value of the domestic shares portfolio, due primarily to the decline in share prices on the Tel Aviv Stock Exchange (TASE).
§ As a result of the above developments, the share of tradable assets in the portfolio declined by 0.3 percentage points in the second quarter while the share of deposits abroad increased.
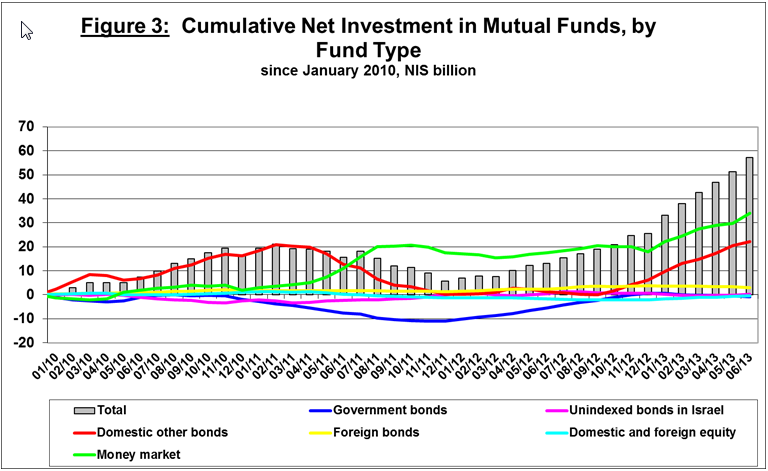
§ There was a net increase of around NIS 14.6 billion (7.7 percent) in the section of the portfolio managed through mutual funds in the second quarter of 2013, in money market funds and in funds that specialize mainly in CPI-indexed corporate bonds.
1. The total assets portfolio
In the second quarter of 2013 the value of the public's financial assets portfolio declined by about 1.2 percent in real terms, and reached NIS 2.76 trillion at the end of June.
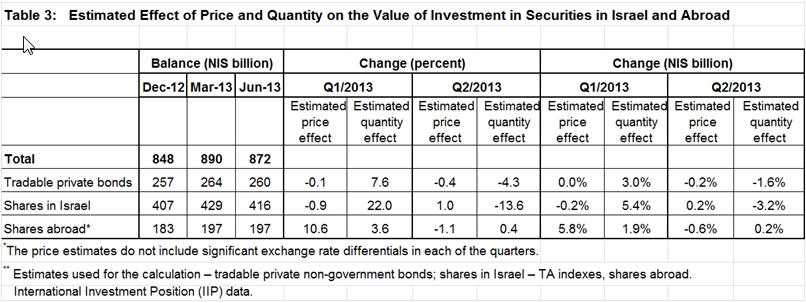
The decline was due primarily to a decline in the value of the securities portfolio on the Tel Aviv Stock Exchange—a decline of about NIS 13 billion (2.9 percent) in the value of the Israel shares portfolio, due primarily to a decline in share prices, and about NIS 5 billion (1.8 percent) in the value of bonds traded in Israel.


Shares in Israel
The assets portfolio abroad

The value of the portfolio managed by Israeli mutual funds was NIS 205 billion at the end of June, about 7 percent of the public's total asset portfolio and about 16 percent of the tradable portfolio. In the second quarter of 2013, the value of mutual fund assets increased by about NIS 16 billion (8.4 percent)—the combination of NIS 14.6 billion in net accumulations (surplus of issues over deposits, minus dividends), and price increases in the markets.
A breakdown of mutual funds by specialization shows that net increases in the second quarter of the year were concentrated “other” bonds (about NIS 7.4 billion or 12.9 percent)—mainly CPI-indexed corporate bonds, and money market funds (NIS 6.6 billion, 13.1 percent). In contrast, there were net deposits in the foreign bond component (about NIS 0.6 billion, 8 percent).