To view this message as a file, click here.
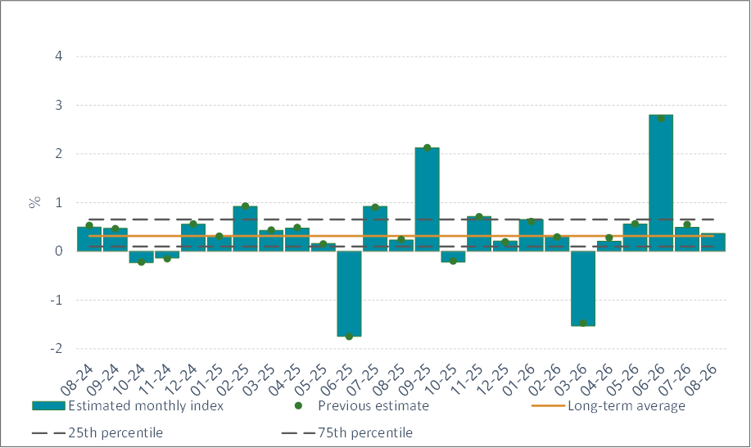
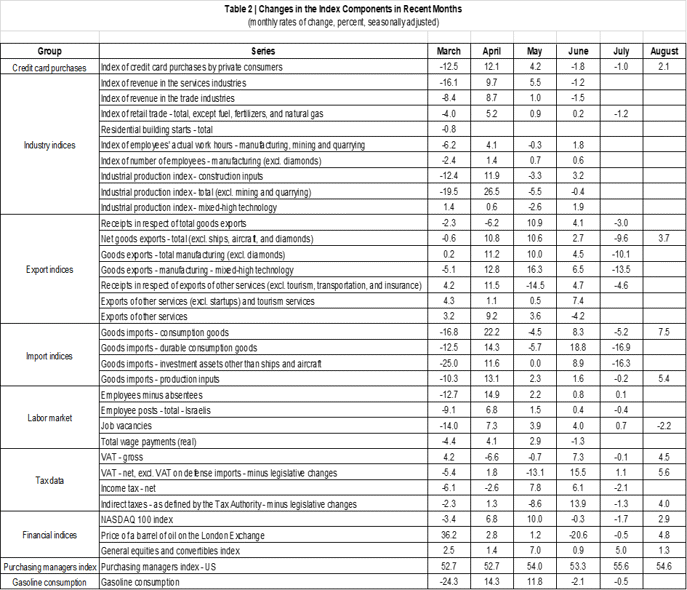
The monthly Index of Economic Activity[1] increased by 0.4 percent in August. The Index this month reflects the average monthly growth estimate for the three months from June to August. The Index was positively affected by imports of consumption goods and of manufacturing inputs, and by VAT and indirect tax receipts in August. Actual GDP figures for the second quarter also contributed positively to the Index. In contrast, credit card purchases, goods exports—particularly manufacturing exports, the retail trade index, employee post figures, and the NASDAQ 100 index in July, as well as job vacancy figures for August, moderated the increase in the Index (Tables 1 and 2).
The pace of increase of the index is above the long-term growth trend (about 0.3 percent).
The Index for July was revised slightly downward, and the estimate for June was revised slightly upward, following the publication of final data for previous months.
Figure 1 presents the Index data over the past two years. Table 1 presents the contributions of the Index’s components to the overall estimate and the revisions to the Index, and Table 2 presents the monthly rate of change in the Index’s components.
FIGURE 1: The Monthly Index of Economic Activity
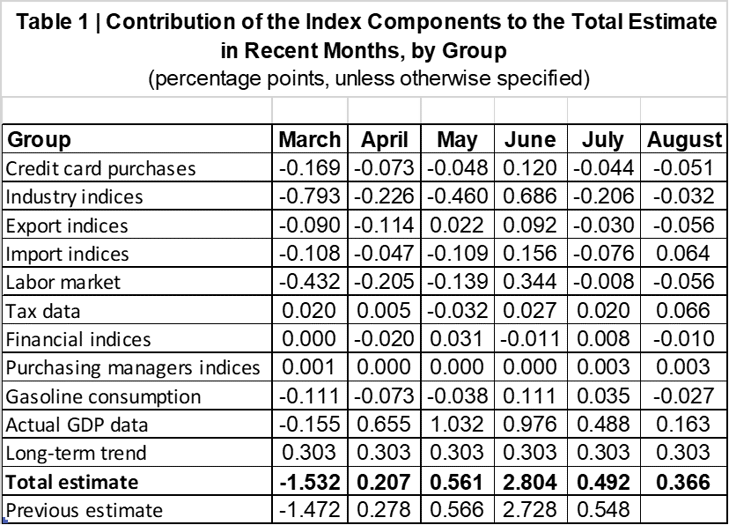
* The table presents the contribution of each group of components in the monthly index, such that the monthly estimate constitutes the sum of the contributions of each of the components detailed in the table. Some of the raw data influence the monthly estimate with a lag or influence the estimates of several months.
[1] The monthly Index of Economic Activity reflects the three-month average of the estimated monthly growth of GDP. The estimate is based on a model developed at the Bank of Israel (Ginker and Suhoy, 2021).