The weights in the existing index were last updated in 2015. Since then, there have been changes in the composition of Israel’s foreign trade. Therefore, the Bank of Israel has examined revising the weights in the index in order for it to most precisely represent the nominal effective exchange rate.
The weights in the revised index are calculated on the basis of the bilateral
flow of trade of goods and services, while adjusting for third party
competition—which is expressed in Israeli exports competing with manufacturers
from a large number of countries in each market to which they are exported, and
not just with domestic manufacturers in that country. The revised index, which is based on total
trade levels from 2017, includes 31 countries and 24 currencies (the difference
being the result of the fact that 8 European countries included in the index
use the same currency—the euro), compared to the existing index that included 33
countries and 26 currencies.
The update of the weights led to an increase in the weight of the US dollar and in the weight of the Chinese yuan, in parallel with a decline in the weight of the eurozone countries. In total, the effect of the changes on the index itself is not large, and the new index indicates a similar picture to that described by the development of the old index. As a result of the strengthening of the dollar worldwide in the past year, the revised index indicates slightly less appreciation of the shekel than the old index. The change amounts to about 0.9 percentage points in total over the 5-year period from 2015 to 2019. However, even according to the new index, the shekel is the most appreciated it has been in a long time.
|
Table: Revision of the weights of the major currencies in the effective exchange rate (percent) |
||
|
|
Old weight |
New weight |
|
Euro |
26.4 |
24.4 |
|
US Dollar |
26.4 |
28.7 |
|
Chinese Yuan |
10.2 |
11.5 |
|
Pound Sterling |
6.0 |
6.4 |
|
Turkish lira |
4.6 |
3.7 |
|
Other currencies[1] |
26.4 |
25.3 |
Figure: The new effective exchange rate index, and the existing index – Levels*
January 1, 2015 =100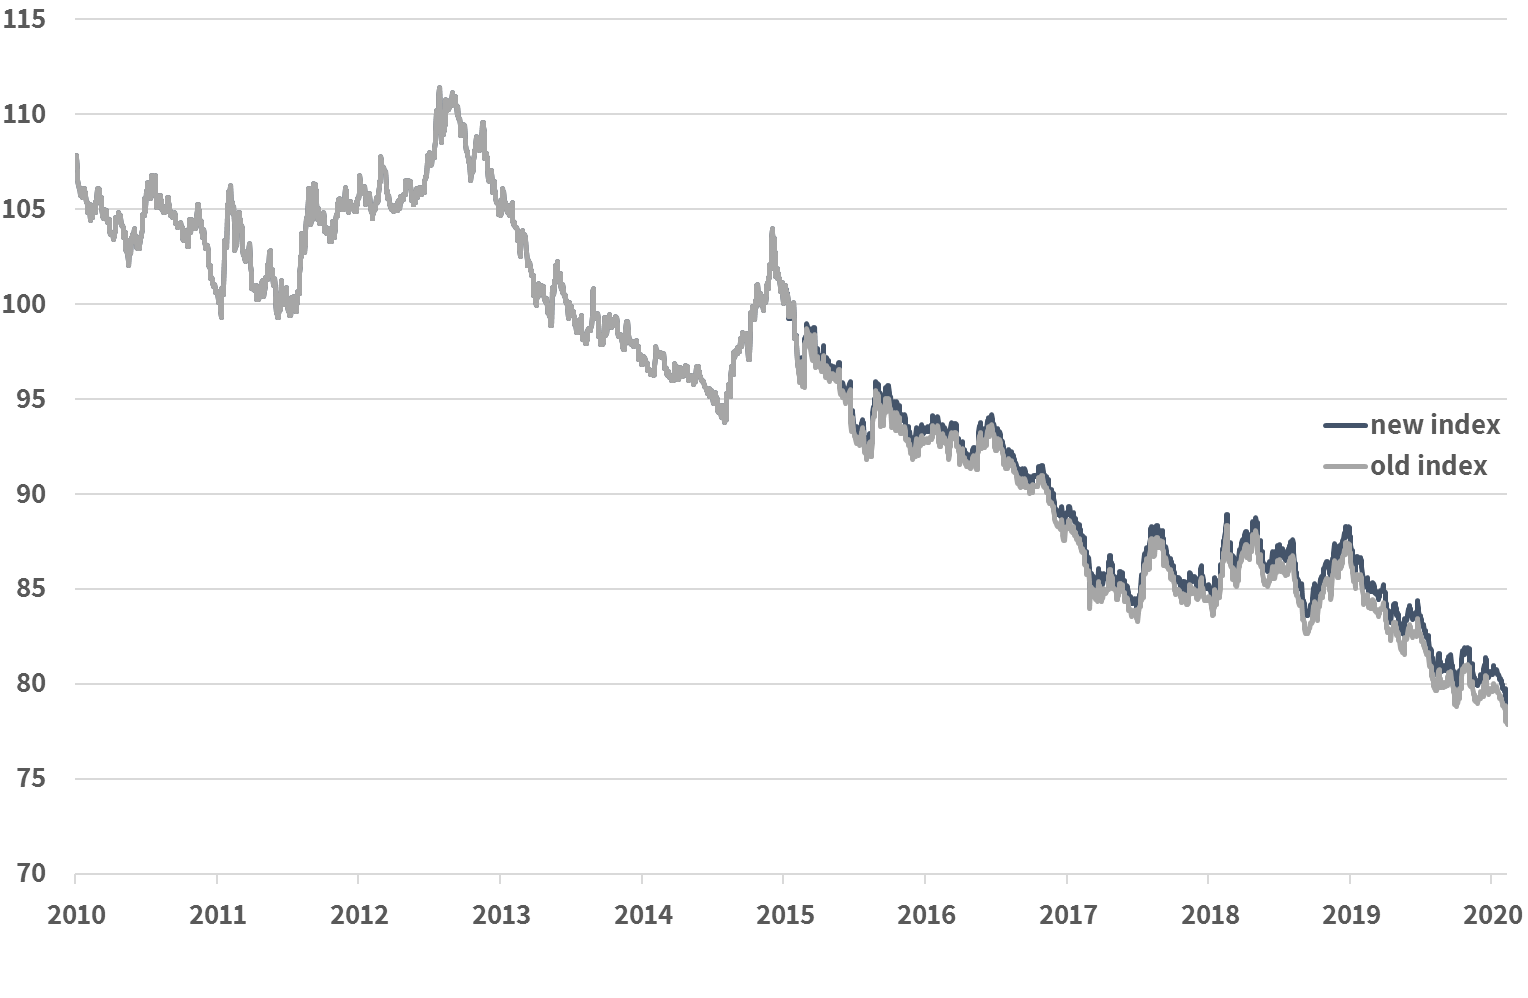
*Daily data, January 1, 2010 – February 10, 2020