![]() To view this press release as a Word document
To view this press release as a Word document
1. The Exchange Rate
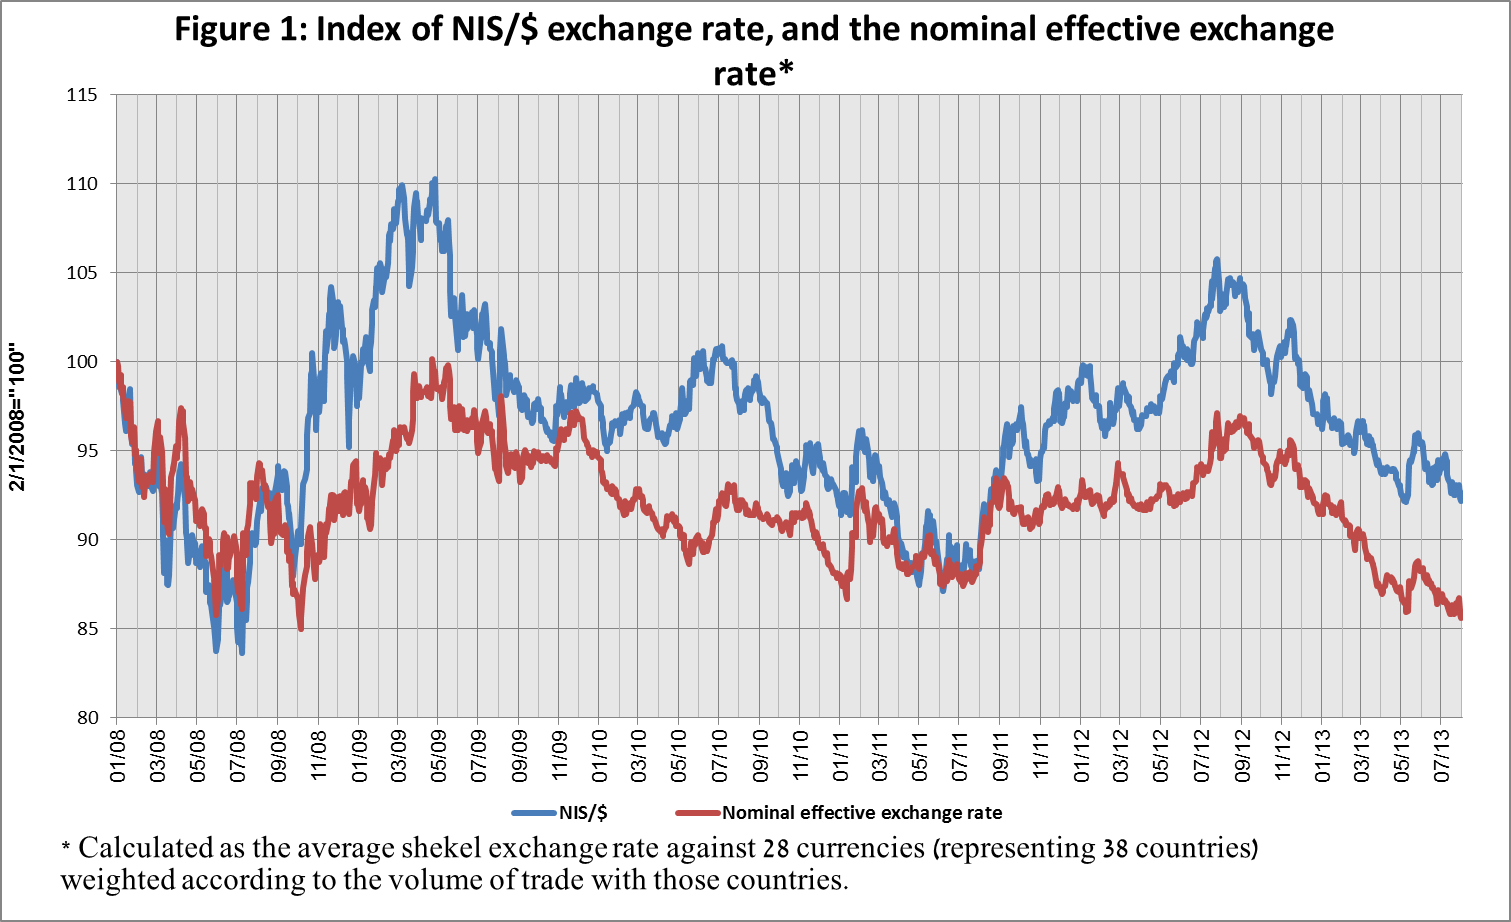
The shekel strengthened against the dollar, in parallel with the dollar's weakness against global currencies.
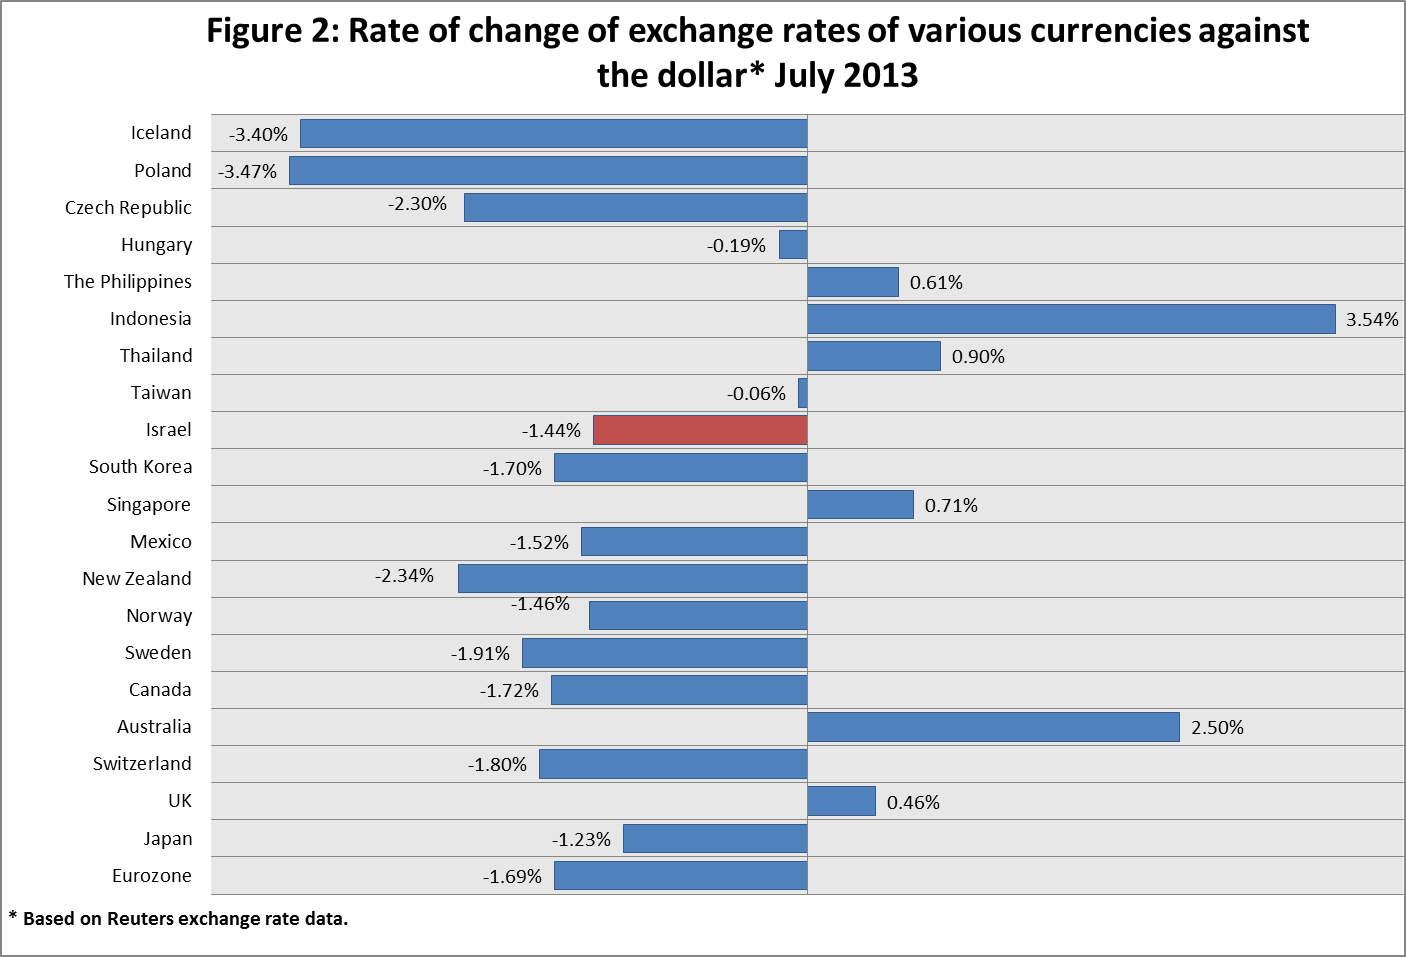
The shekel strengthened by about 1.4 percent against the dollar, while weakening by about 0.2 percent against the euro during July. Against the currencies of Israel's main trading partners, in terms of the nominal effective exchange rate of the shekel (i.e., the trade-weighted average shekel exchange rate against those currencies), the shekel strengthened by about 0.8 percent.
In July, the dollar weakened against most global currencies—including by about 1.8 percent against the Swiss franc, by about 1.7 percent against the euro, and by about 1.2 percent against the Japanese yen.
2. Exchange Rate Volatility
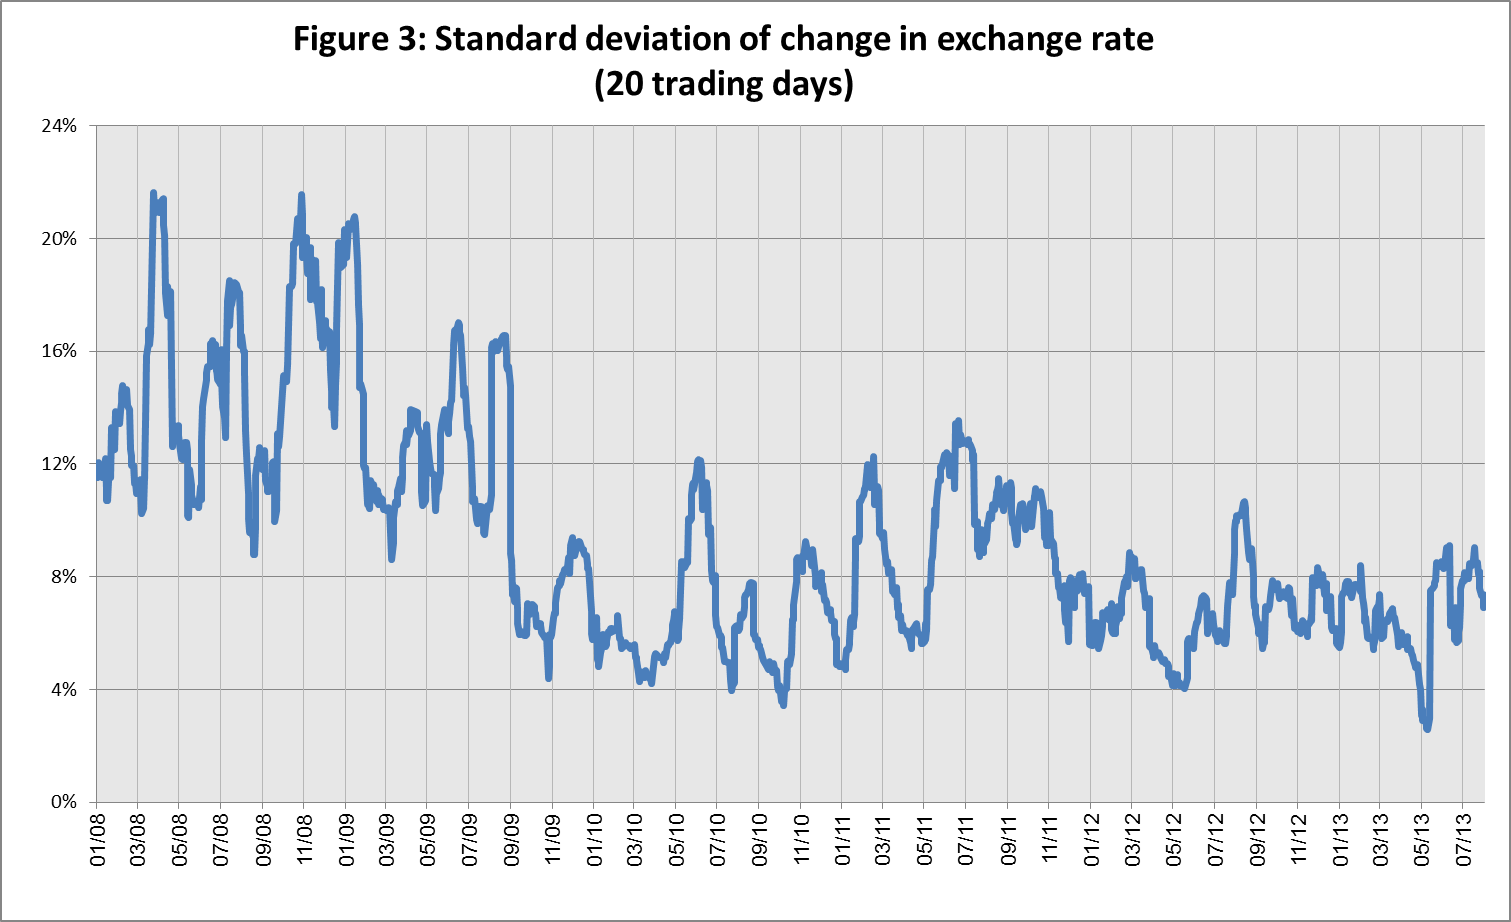
Actual volatility and implied volatility of the exchange rate declined.
The standard deviation of changes in the shekel-dollar exchange rate, which represents its actual volatility, declined in July by about 0.3 percentage points to 7.3 percent, compared with 7.6 percent in June.
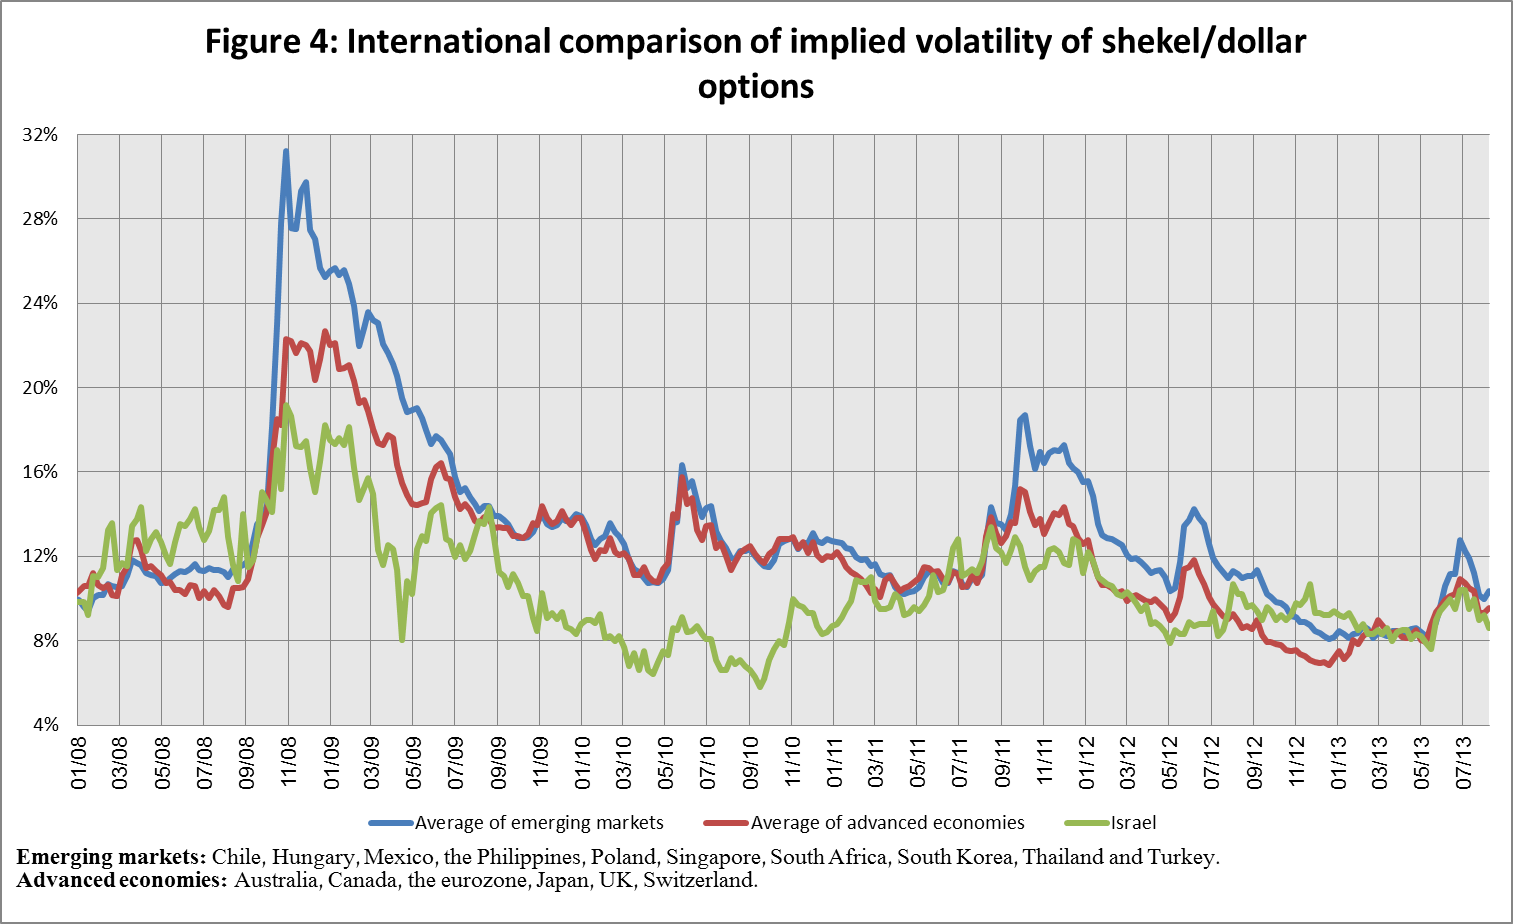
The average level of implied volatility in over the counter shekel-dollar options––an indication of expected exchange rate volatility––declined to 9.6 percent at the end of July, compared with 9.9 percent in June.
In July, the implied volatility in foreign exchange options declined in both emerging and advanced economies—to 11.1 percent in emerging markets and 10.0 percent in advanced economies, compared with 11.4 percent in emerging markets and 10.3 percent in advanced economies in June.
3. The Volume of Trade in the Foreign Currency Market
Average daily trading volume declined, primarily as a result of a decline in the rate of foreign residents involved in spot, forward and swap transactions.
The total volume of trade in foreign currency in July was about $83.5 billion, compared with about $85 billion in June. Average daily trading volume declined by about 10.5 percent in July, and reached about $3.8 billion.
The volume of trade in spot and forward transactions (conversions) was about $33 billion in July, compared with $36 billion in June. The average daily trading volume in those transactions declined in July by about 15.5 percent compared with June. During July, the Bank of Israel bought $255 million through conversion transactions[1], as part of the purchase program intended to offset the effect on the exchange rate of natural gas production.
The volume of trade in over the counter foreign currency options (which are not traded on the stock exchange) totaled about $8.5 billion in July. The average daily trading volume in those options in July was $385 million, a decline of about 13 percent from its level in June.
The trading volume of swap transactions was about $46 billion in July. Average daily turnover declined by around 6 percent, as a result of a decline of about 23 percent in the volume of nonresidents’ transactions.
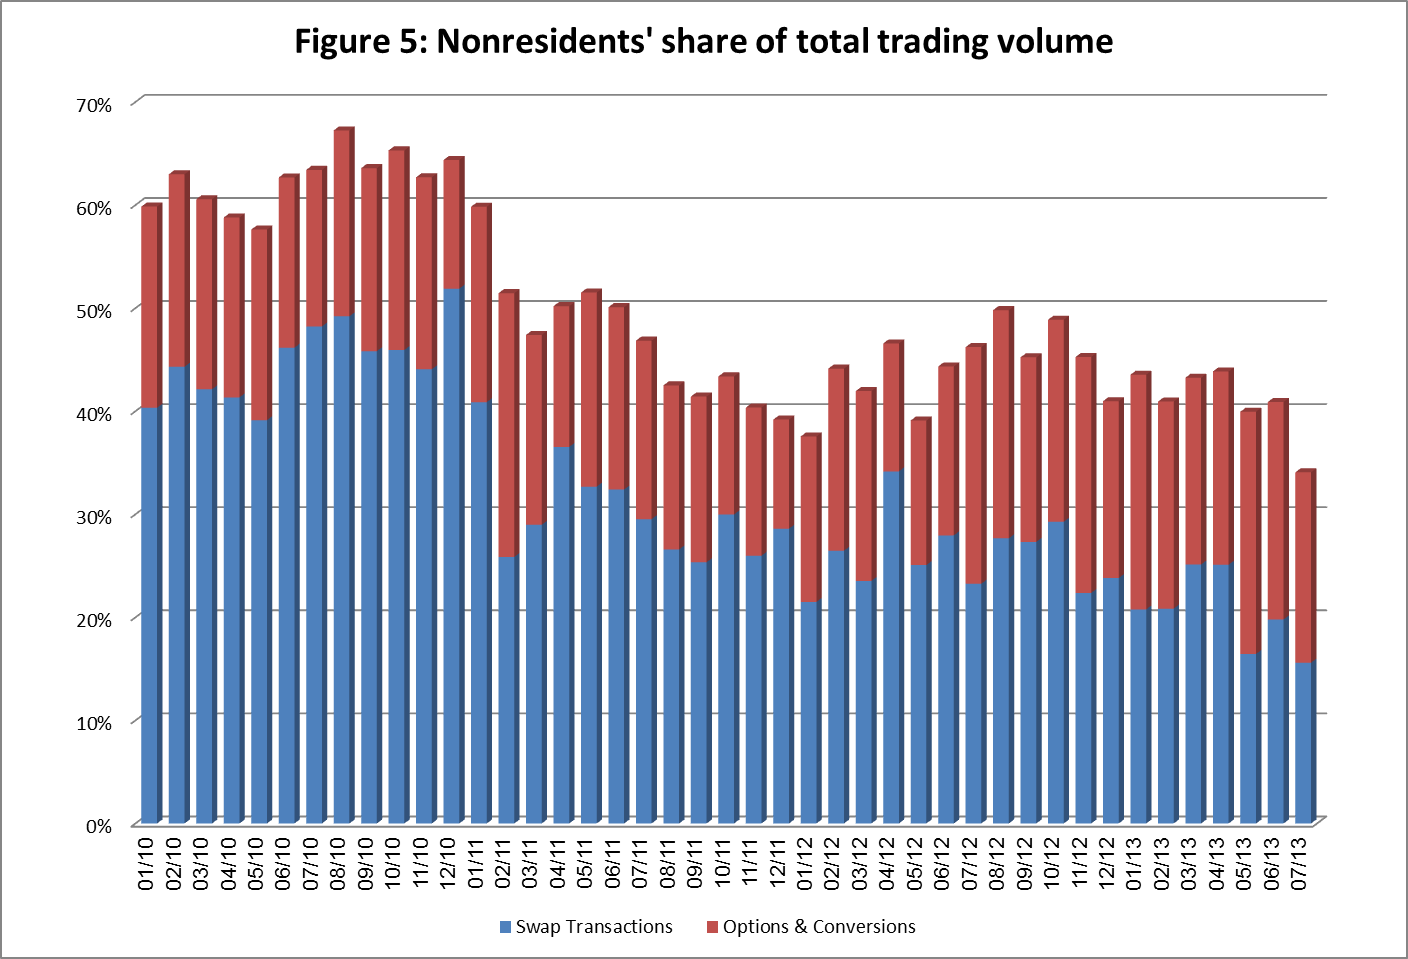
Nonresidents' share of total trade (spot and forward transactions, options and swaps) declined by about 7 percentage points in July to about 33.7 percent. There was a decline of about 10 percentage points in nonresidents’ share of swap transactions in July.
[1] This figure reflects transactions by trade date, not settlement date. Therefore, it is not identical to the data published in the foreign exchange reserves notice, which reflects transactions by settlement date.
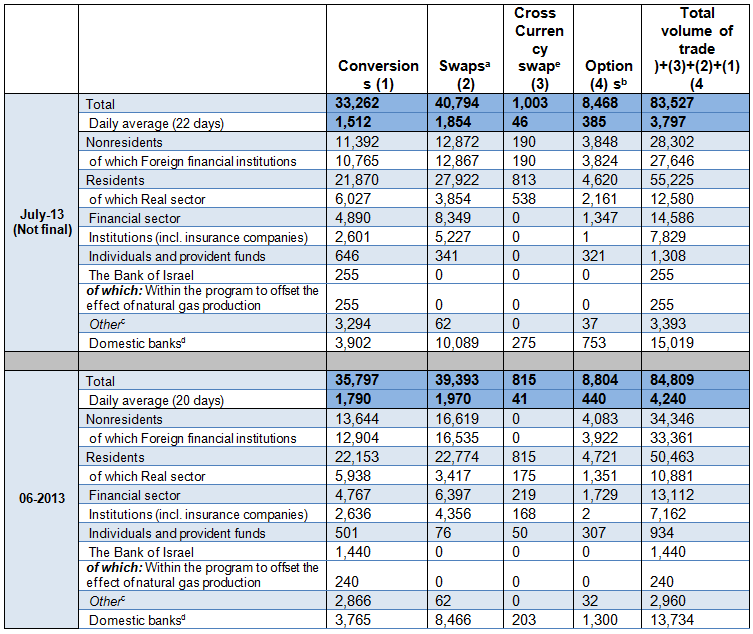
a Only one leg of the swap, i.e., the nominal value of the transaction (in accordance with the BIS definition).
b The notional value, that includes purchases and sales of put and call options.
c Including other entities such as portfolio managers, nonprofit organizations, national institutions, and those not included elsewhere.
d Total interbank trade, divided by 2