![]() To view this press release as a Word document
To view this press release as a Word document
1. The Exchange Rate
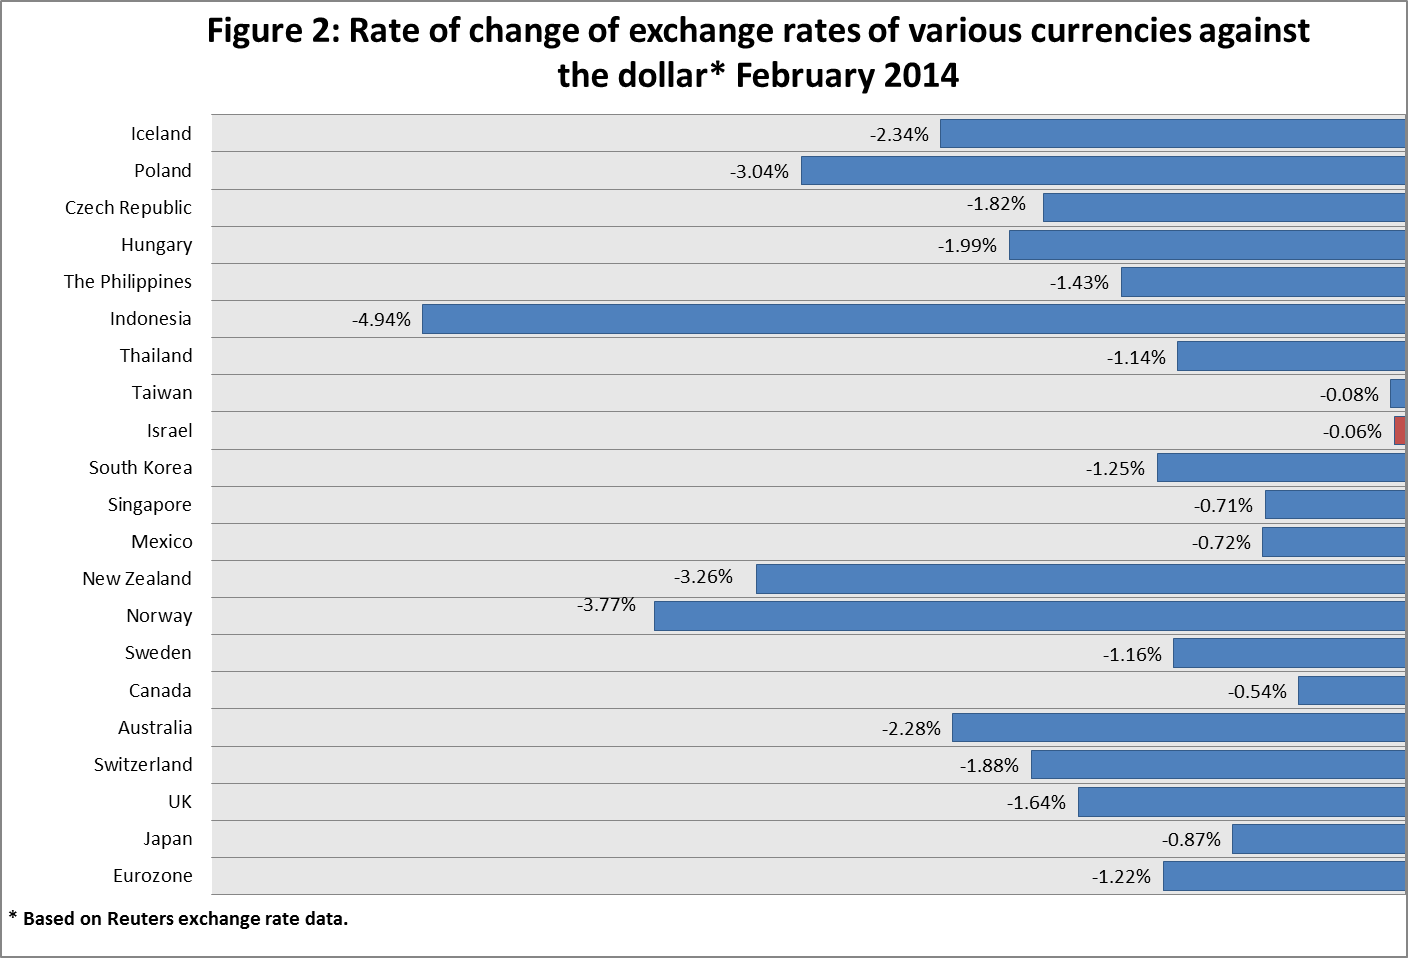
The shekel was stable against the dollar, in contrast with the dollar's weakness against global currencies.
The shekel remained unchanged against the dollar, and weakened by about 1.3 percent against the euro during February. Against the currencies of Israel's main trading partners, in terms of the nominal effective exchange rate of the shekel (i.e., the trade-weighted average shekel exchange rate against those currencies), the shekel weakened by about 0.6 percent.
In February, the dollar weakened against most global currencies—including by about 1.9 percent against the Swiss franc, by about 1.2 percent against the euro, by about 1.6 percent against the British pound, and by about 0.9 percent against the Japanese yen.
2. Exchange Rate Volatility
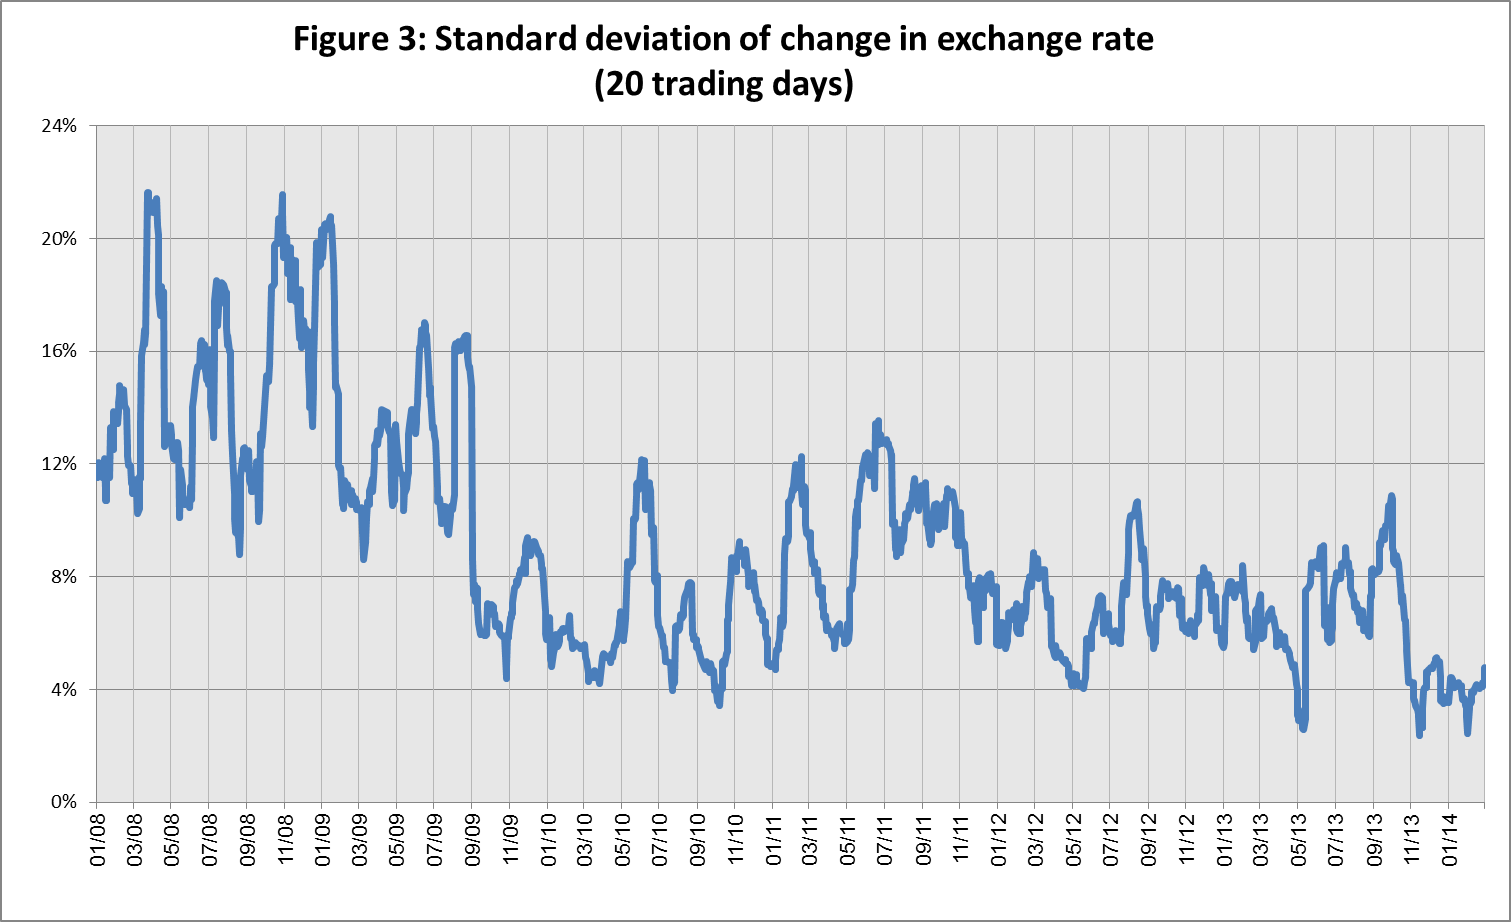
Actual volatility of the exchange rate increased, in contrast with a decline in its implied volatility.
The standard deviation of changes in the shekel-dollar exchange rate, which represents its actual volatility, increased in February by about 1.6 percentage points to 4.8 percent, compared with 3.2 percent in January.
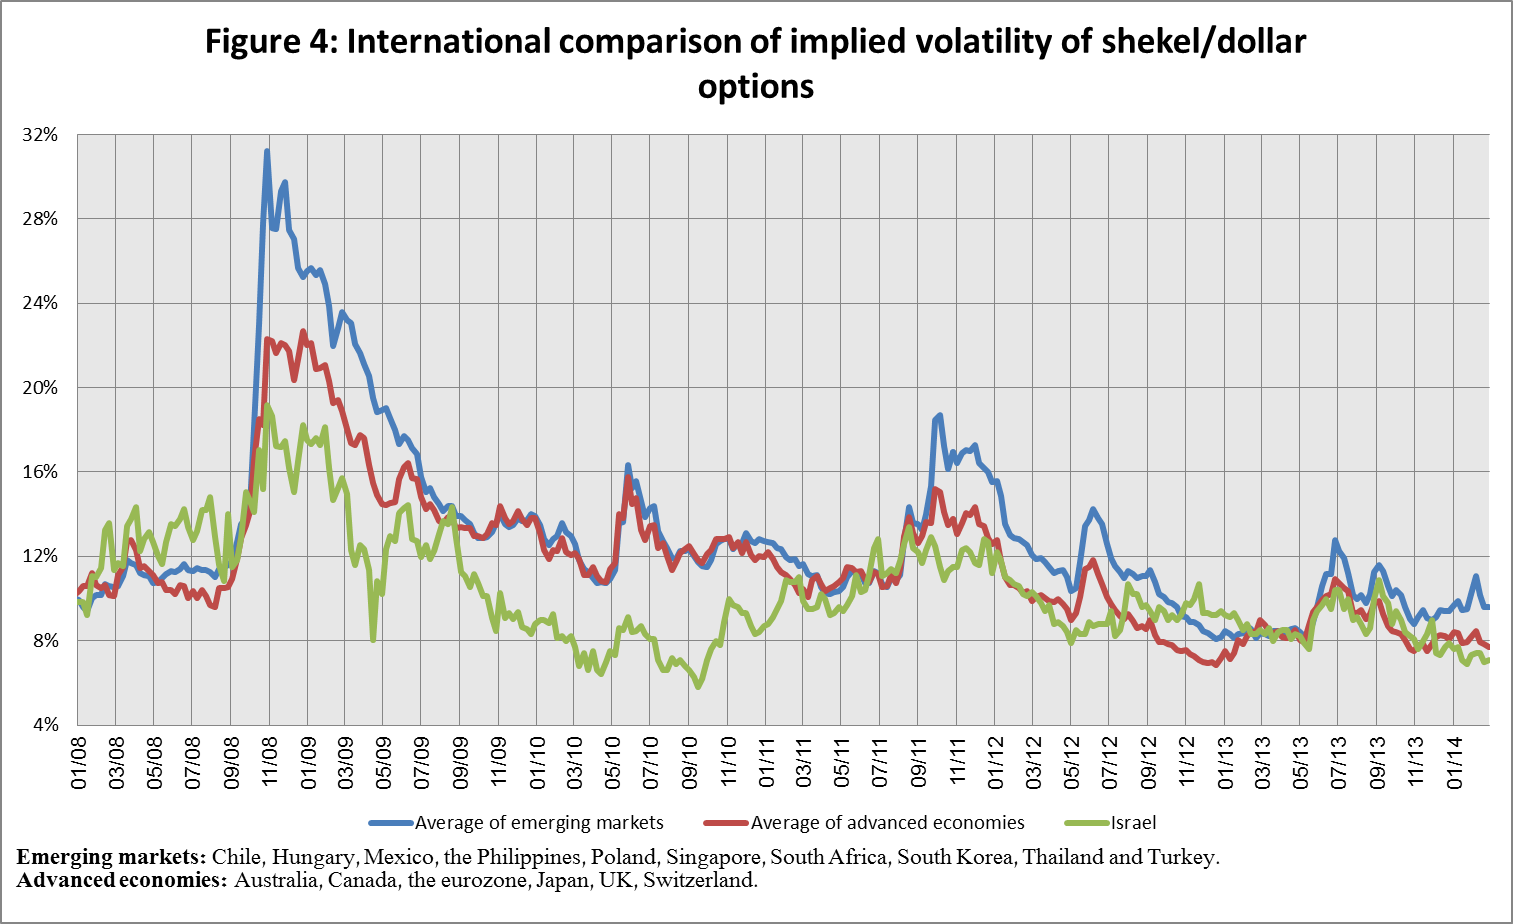
The average level of implied volatility in over the counter shekel-dollar options––an indication of expected exchange rate volatility––declined to 7.1 percent at the end of February, compared with 7.3 percent in January.
In February, the implied volatility in foreign exchange options in emerging markets increased, reaching 10.1 percent on average, compared with 9.7 percent in January. In contrast, the implied volatility in foreign exchange options in advanced economies declined in February, to 8 percent at the end of the month.
3. The Volume of Trade in the Foreign Currency Market
Average daily trading volume declined, with stability in non-residents’ share of total trading volume
The total volume of trade in foreign currency in February was about $88 billion, compared with about $102 billion in January. Average daily trading volume increased by about 5 percent in February, and reached about $4.4 billion.
The volume of trade in spot and forward transactions (conversions) was about $32 billion in February, compared with $38 billion in January. The average daily trading volume in those transactions declined in February by about 8 percent compared with January. During February, the Bank of Israel bought $490 million through conversion transactions[1], including $290 million as part of the purchase program intended to offset the effect of natural gas production on the exchange rate.
The volume of trade in over the counter foreign currency options (which are not traded on the stock exchange) totaled about $9 billion in February. The average daily trading volume in those options in February was about $450 million, a decline of about 5 percent from its level in January.
The trading volume of swap transactions was about $46 billion in February. Average daily turnover was unchanged from the previous month, at around $2.3 billion.
Nonresidents' share of total trade (spot and forward transactions, options and swaps) remained unchanged in February, at about 31 percent.