 To view this press release as a Word document
1. The Exchange Rate
The shekel strengthened against the dollar, in parallel with the dollar's weakness against global currencies.
During November, the shekel strengthened by about 1.5 percent against the dollar, and remained stable against the euro. Against the currencies of Israel's main trading partners, in terms of the nominal effective exchange rate of the shekel (i.e., the trade-weighted average shekel exchange rate against those currencies), the shekel strengthened by about 1.3 percent. Worldwide, the dollar weakened against most global currencies in December—including by about 1 percent against the euro, by about 1.3 percent against the British pound, and by about 1.6 percent against the Swiss franc.
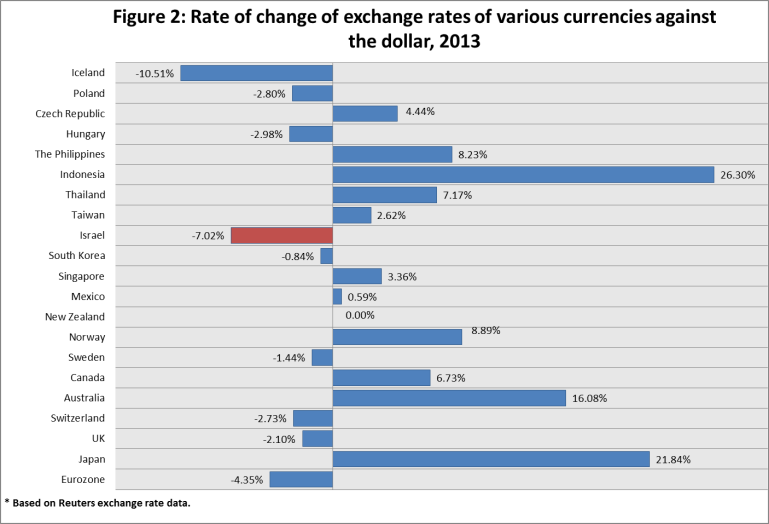
In 2013, the shekel strengthened by about 7 percent against the dollar, and by about 2.8 percent against the euro.
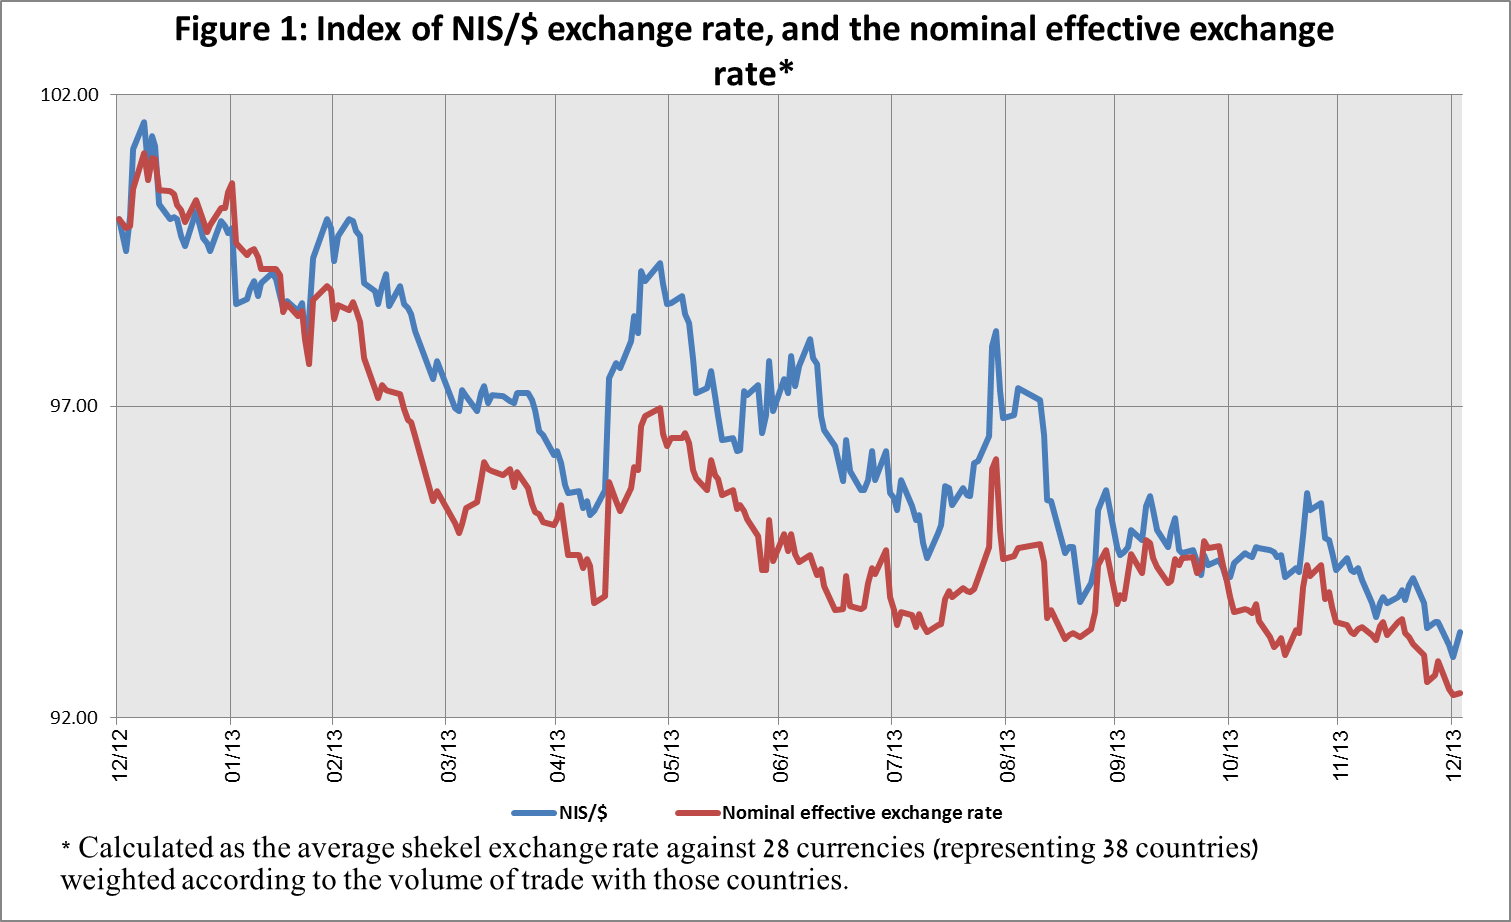
Against the currencies of Israel's main trading partners, in terms of the nominal effective exchange rate of the shekel (i.e., the trade-weighted average shekel exchange rate against those currencies), the shekel strengthened by about 7.6 percent, mainly during the first half of the year—about 6 percent by mid-May.
In 2013, the dollar weakened worldwide against the currencies of most advanced economies, including by about 4.4 percent against the euro, by about 2.1 percent against the British pound, and by about 2.7 percent against the Swiss franc. In contrast, the dollar strengthened by about 11 percent against the currencies of emerging economies, on average.
2. Exchange Rate Volatility
Actual and implied volatility of shekel-dollar options declined.
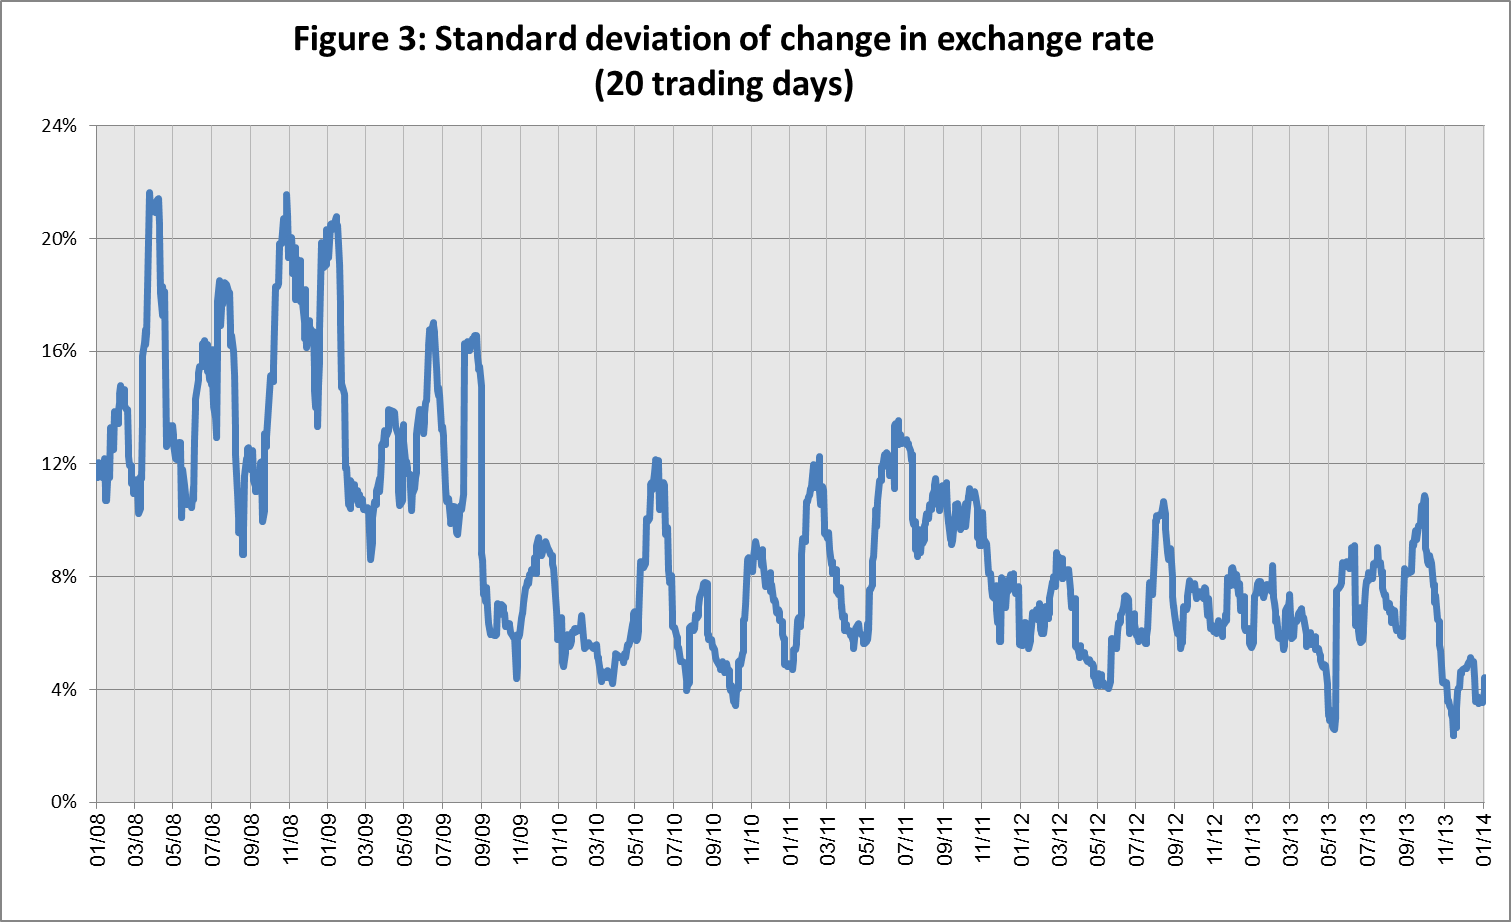
The monthly standard deviation of changes in the shekel-dollar exchange rate, which represents its actual volatility, declined in 2013 by about 2 percentage points to 3.5 percent in December, further to a decline of about 2 percentage points in actual volatility during 2012.
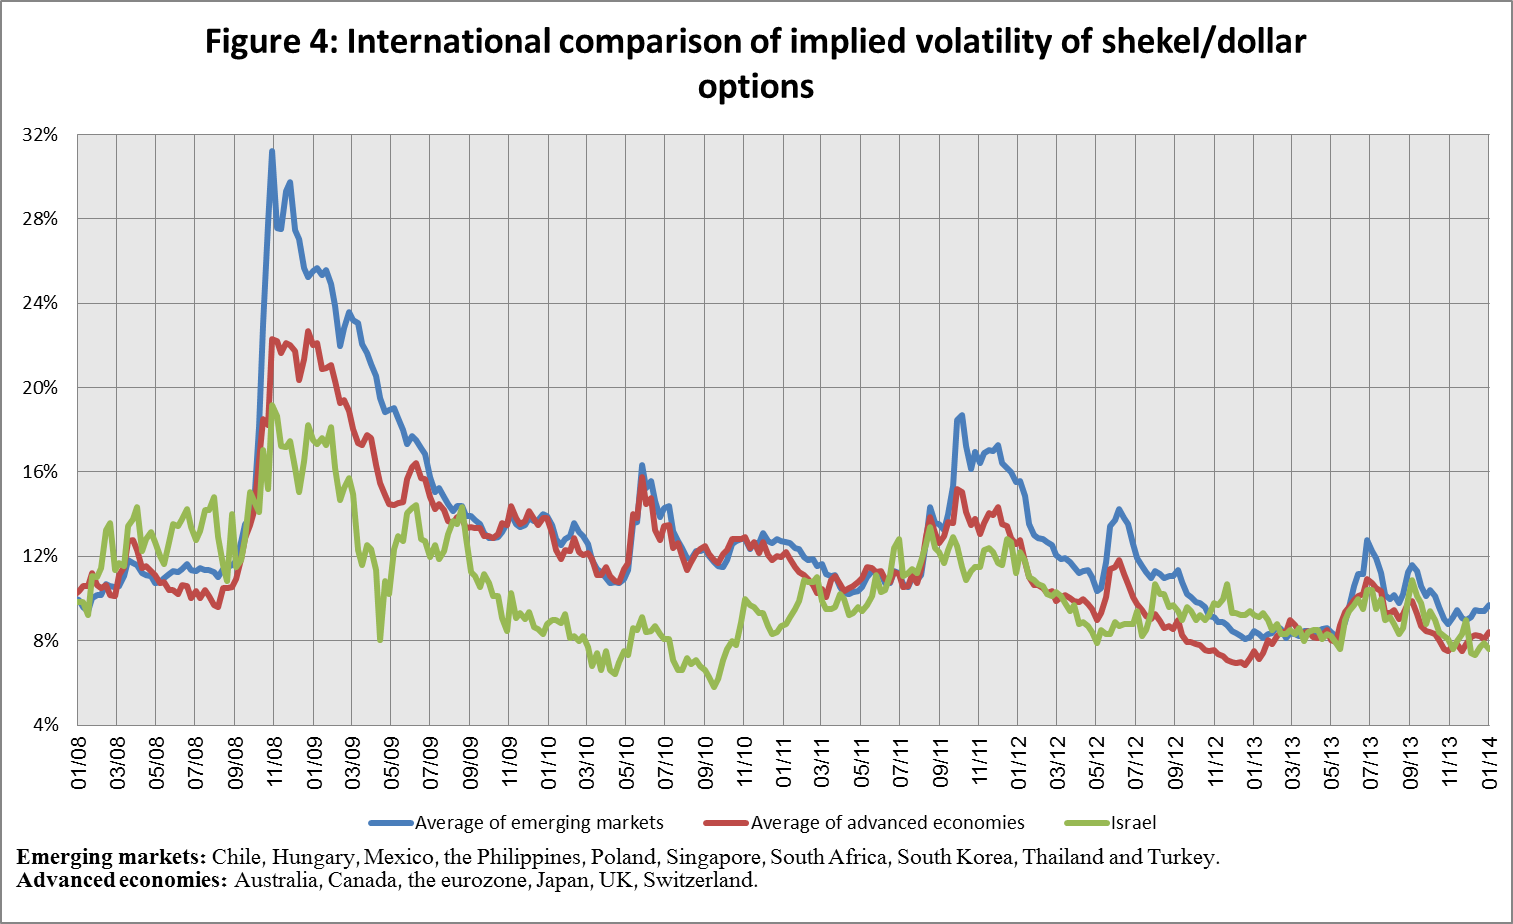
The average monthly level of implied volatility in over the counter shekel-dollar options––an indication of expected exchange rate volatility––declined by about 1.8 percentage points during 2013 to about 7.6 percent, contrary to the trend of implied volatility in foreign exchange options in emerging and advanced markets, which increased by about 1.1 percentage points during the year to stand at 9.4 percent in emerging markets and 8.2 percent in advanced markets.
3. The Volume of Trade in the Foreign Currency Market
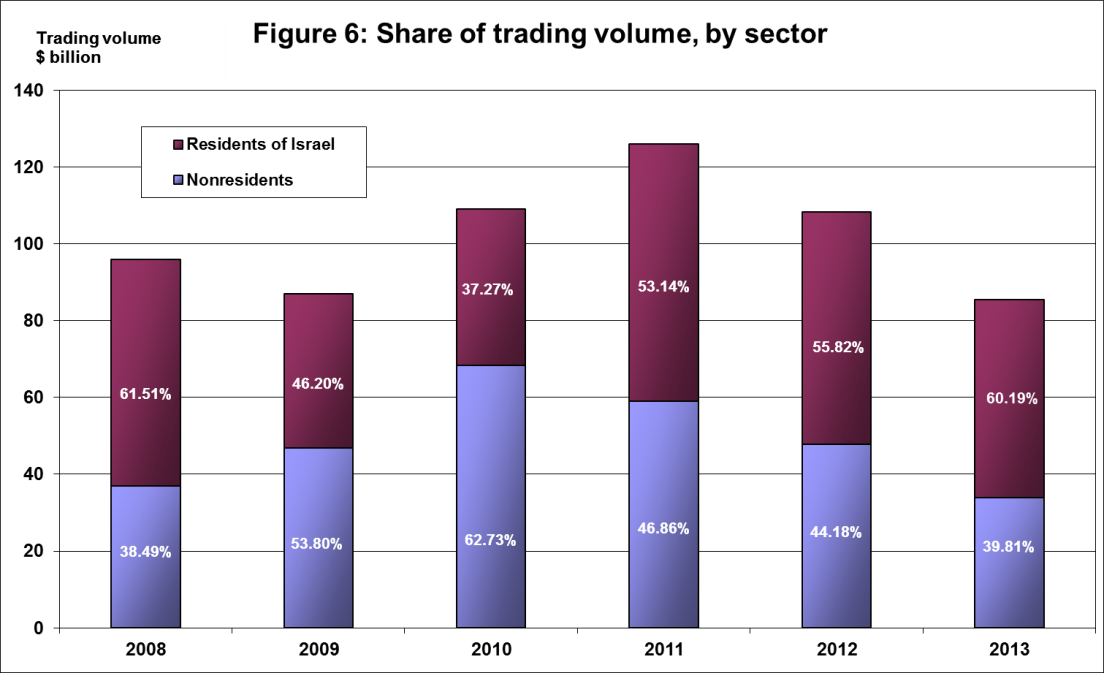
Average daily trading volume declined sharply during 2013, in parallel with a decline in non-residents’ share of total trading volume
The total volume of trade in foreign currency in December was about $87 billion, compared with about $80 billion in November. Trading volume in swap transactions increased by about 18 percent to about $43 billion.
During December, the Bank of Israel bought $560 million through conversion transactions, of which $260 million was as part of the purchase program intended to offset the effect of natural gas production on the exchange rate.
The average daily volume of trade in foreign currency in 2013 was about $4.4 billion, a decline of about 16 percent compared to 2012, continuing the decline in trading volume in the foreign currency market from 2012.
Most of the decline in volume was concentrated in swap transactions, where there was an average decline of about 24 percent to an average monthly level of about $42 billion in 2013.
The average volume of trade in spot and forward transactions (conversions) declined by about 13 percent to about $33 billion per month in 2013. The volume of trade in options also declined, by about 6 percent.
During 2013, the Bank of Israel purchased about $5.3 billion through conversion transactions, of which about $2.1 billion were as part of the purchase program intended to offset the effect of natural gas production on the exchange rate.
Nonresidents' average share of total trade (spot and forward transactions, options and swaps) declined by about 5 percentage points in 2013 to about 39 percent, further to the decline of about 2.5 percentage points during 2012.
This figure reflects transactions by trade date, not settlement date. Therefore, it is not necessarily identical to the data published in the foreign exchange reserves notice, which reflects transactions by settlement date. 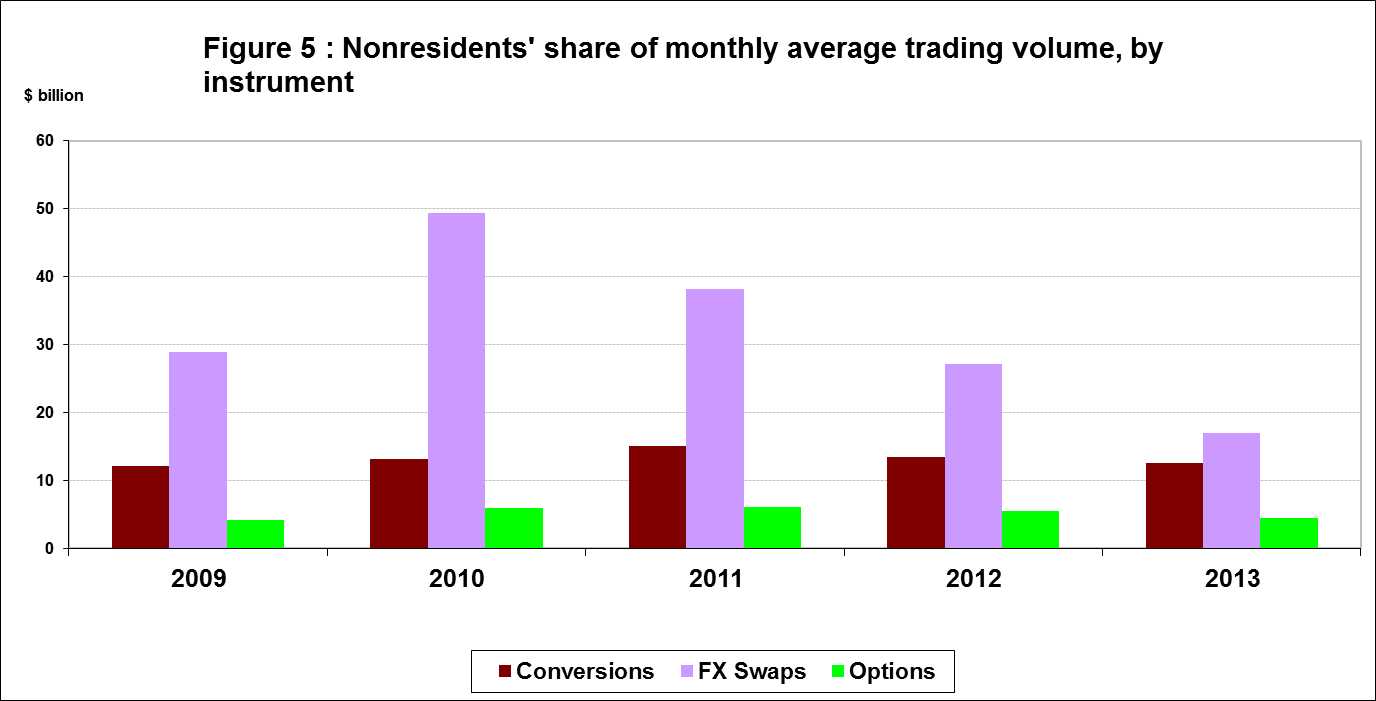
Forex transactions with domestic banks, by instruments and sectors
($ million)
|
|
Conversions (1) |
|
|
|
Total volume of trade (1)+(2)+(3)+(4) |
December
2013
(Not final) |
Total |
33,243 |
43,456 |
577 |
10,035 |
87,311 |
Daily average (21 days) |
1,583 |
2,069 |
27 |
478 |
4,158 |
Nonresidents |
11,029 |
15,097 |
0 |
4,044 |
30,170 |
of which Foreign financial institutions |
10,315 |
15,025 |
0 |
3,993 |
29,333 |
Residents |
22,214 |
28,359 |
577 |
5,991 |
57,141 |
of which Real sector |
6,611 |
4,606 |
0 |
2,245 |
13,462 |
Financial sector |
4,436 |
11,095 |
200 |
2,474 |
18,205 |
Institutions (incl. insurance companies) |
2,341 |
4,610 |
177 |
186 |
7,314 |
Individuals and provident funds |
906 |
395 |
0 |
319 |
1,620 |
The Bank of Israel |
560 |
0 |
0 |
0 |
560 |
of which within the program to offset the gas effect |
260 |
0 |
0 |
0 |
260 |
|
3,484 |
38 |
0 |
12 |
3,534 |
|
3,876 |
7,615 |
200 |
755 |
12,446 |
November 2013 |
Total |
31,437 |
36,760 |
1,104 |
11,567 |
80,868 |
Daily average (23 days) |
1,497 |
1,750 |
53 |
551 |
3,851 |
Nonresidents |
13,076 |
12,218 |
160 |
5,368 |
30,822 |
of which Foreign financial institutions |
12,351 |
12,201 |
160 |
5,242 |
29,954 |
Residents |
18,361 |
24,542 |
944 |
6,199 |
50,046 |
of which Real sector |
5,781 |
3,998 |
0 |
1,914 |
11,693 |
Financial sector |
3,181 |
7,768 |
182 |
1,353 |
12,484 |
Institutions (incl. insurance companies) |
1,827 |
4,291 |
0 |
60 |
6,178 |
Individuals and provident funds |
646 |
219 |
0 |
208 |
1,073 |
The Bank of Israel |
270 |
0 |
0 |
0 |
270 |
of which within the program to offset the gas effect |
270 |
0 |
0 |
0 |
270 |
|
2,991 |
49 |
275 |
1,122 |
4,437 |
|
3,665 |
8,217 |
487 |
1,542 |
13,911 |
Only one leg of the swap, i.e., the nominal value of the transaction (in accordance with the BIS definition) The exchanged founds through Cross Currency Swap transactions considered for the volume, as one leg only in cases where the two legs offset each other. The national value, that includes purchases and sales of put and call options. Including other entities such as portfolio managers, nonprofit organizations, national institutions, and those not include elsewhere. Total interbank trade, divided in two.