To view this message as a file click here
To view the data as a file click here
The following is a summary of developments in nonfinancial private sector debt in the third quarter of 2023:
- The balance of nonfinancial private sector debt continued to increase in the third quarter, by approximately 0.9 percent. However, the slowdown in the annual growth rate of this balance, which began in the second half of 2022, continued, both with regard to the business sector and with regard to the household sector.
- The balance of business sector debt increased by about 1 percent (about NIS 12 billion) during the quarter, to about NIS 1.3 trillion. This was mainly due to the depreciation of the shekel against the US dollar and the increase in the Consumer Price Index. It was also due to net debt raised, though this amount was at lower volumes than in previous quarters.
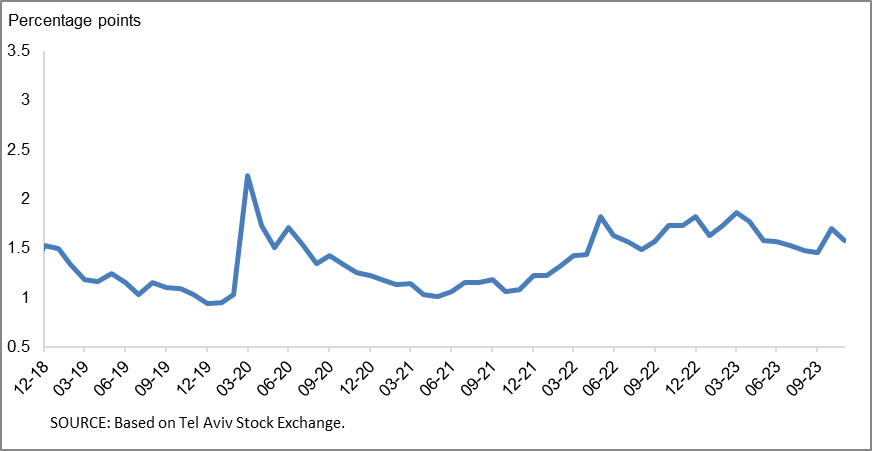
- The spread between the yields on corporate bonds included in the Tel Bond 60 index and the yields on indexed government bonds narrowed to about 1.45 percentage points. In October this spread widened slightly, for the first time since the beginning of the year, in view of the Swords of Iron war, while in November, the spread again narrowed to about 1.58 percentage points.
- The balance of household debt continued to increase in the quarter. Housing debt increased by about 1.3 percent to about NIS 563 billion—a rate of increase lower than in previous years. Notwithstanding this increase, the slowdown in new mortgage borrowing continued. It continued into October and November as well, in view of the Swords of Iron war.
- The decline in nonhousing debt that began near the beginning of the year continued. Nonhousing debt declined by about NIS 0.4 billion to about NIS 230 billion in the third quarter, and for the first time since the first quarter of 2021, the year-over-year growth rate of this balance was negative.
The nonfinancial business sector’s[1] outstanding debt
- In the third quarter of 2023, the balance of business sector debt continued to increase, by approximately NIS 12 billion (1 percent), to a level of about NIS 1.3 trillion. However, the slowdown in the balance’s year-over-year growth rate, which began in the second half of 2022, continued.
- The increase in the debt balance in the quarter derived mostly from a depreciation of the shekel by about 3.4 percent vis-à-vis the US dollar, and an increase of about 0.8 percent in the CPI[2], which together increased the value of debt that is foreign currency-denominated, foreign currency-indexed, and CPI-indexed. Net debt raised, totaling about NIS 2 billion, also contributed to the increase in this balance: Bank loans and bonds in Israel and abroad were mostly offset by net repayments of debt raised through nonbank loans issued by nonresidents and institutional investors. (Figures 1, 2).
- As a result of these effects, the slowdown in the year-over-year growth rate of the balance of debt to banks and to nonbank lenders that began in the second half of 2022 continued in the third quarter, but the rate remains high. Debt to banks grew by an annual rate of about 10 percent, compared to 11 percent in the preceding quarter, and debt to nonbank lenders grew by about 4 percent, similar to the previous quarter. In the past two years, the annual growth rate in the balance of debt to banks has been higher than the annual growth rate of debt to nonbank lenders.
- In the third quarter, the business sector issued about NIS 13 billion in bonds, slightly lower than the average quarterly issuance of the past 4 quarters (about NIS 14 billion per quarter, on average). About 44 percent the issuances in this quarter were carried out by companies in the real estate and construction industry, which continues to lead in bond issuances, similar to previous years (Figure 3).
In October 2023, the business sector issued bonds worth about NIS 2 billion, lower than the monthly average in the third quarter (about NIS 4 billion, on average), in view of the Swords of Iron war. Companies from the real estate and construction industry accounted for about 73 percent of the bond issuances in October.
- In the third quarter, the spread[3] between yields on corporate bonds that are included in the Tel Bond 60 Index and the yields on CPI-indexed government bonds narrowed by about 0.11 percentage points, to about 1.45 percentage points. This spread widened slightly in October, for the first time since the beginning of the year and in view of the Swords of Iron war, while it again narrowed to about 1.58 percentage points in November (Figure 4).
Table 1: The Composition of Business Sector Debt
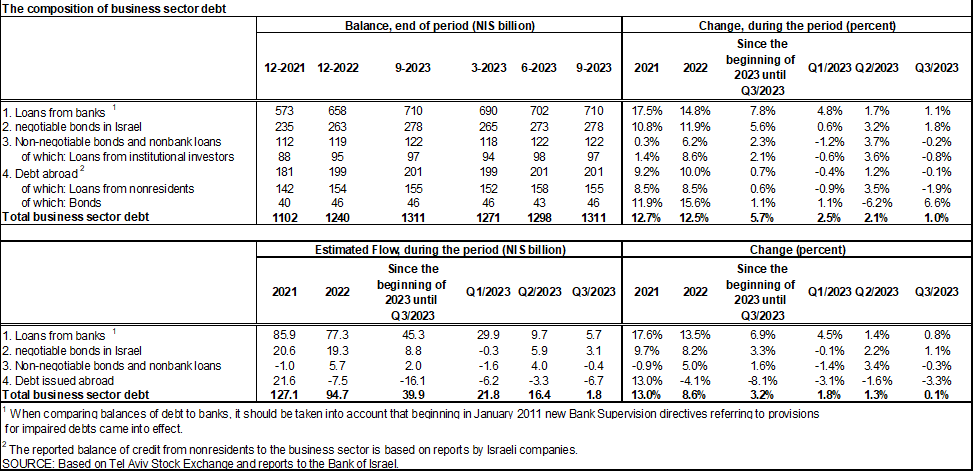
Figure 1: Estimated Net Quarterly Quantitative Change in Business Sector Debt
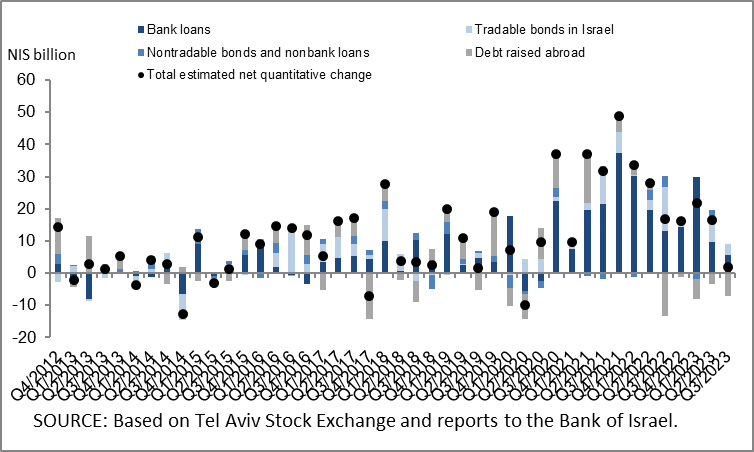
Figure 2: Rate of Change (Year on Year) in the Business Sector's Bank and Nonbank Debt
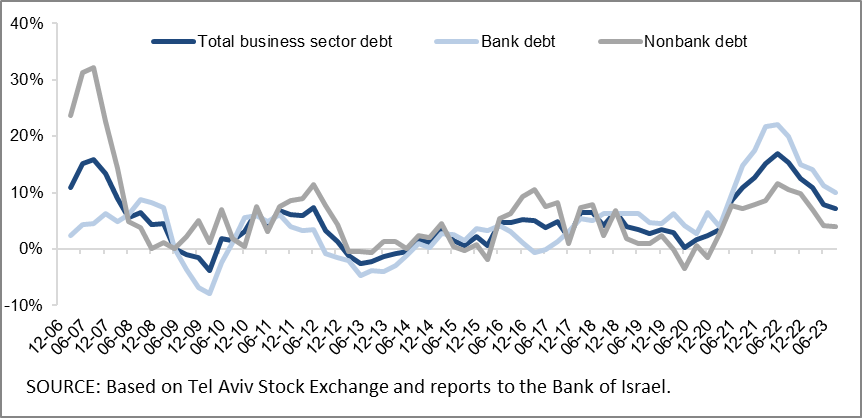
Figure 3: Nonfinancial Business Sector Bond Issuance during the quarter, by Industry
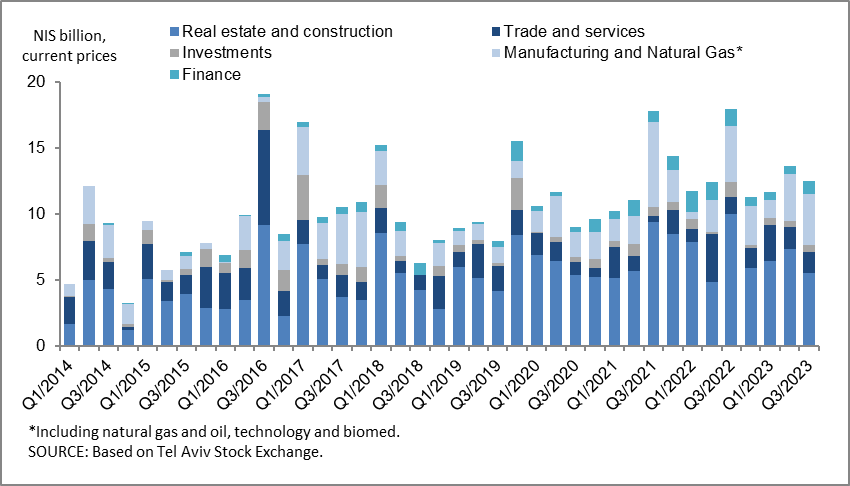
Figure 4 : Spread between Indexed Corporate Bonds (Tel-Bond 60) and Indexed Government Bonds (monthly average)
Household debt
- The balance of households’ outstanding debt continued to grow in the third quarter of 2023, to NIS 793 billion, (an increase of about NIS 7 billion, 0.9 percent). However, the slowdown in its annual rate of growth, which began in the second half of 2022, continued in the third quarter.
- The increase in outstanding household debt was due to an increase in housing debt, mostly to banks. This debt increased by a rate slightly higher than in the previous quarter—about 1.3 percent compared to 1.2 percent, but the rate remains lower than in the previous four years. The decline in nonhousing debt that began at the beginning of the year continued (about NIS 0.4 billion, to about NIS 230 billion), as a result of a decrease in the balance of debt to institutional investors, which was slightly offset by a slight increase in the balance of debt to credit card companies. The balance of debt to the banks remained unchanged during the quarter, at about NIS 163 billion.
- As a result of these effects, the annual growth rates of outstanding housing debt and outstanding nonhousing debt continued to slow, and for the first time since the first quarter of 2021, the annual growth rate of nonhousing debt was negative: an annual growth rate of about 6 percent in the balance of housing debt, and of about -1 percent in the balance of nonhousing debt (Figure 5).
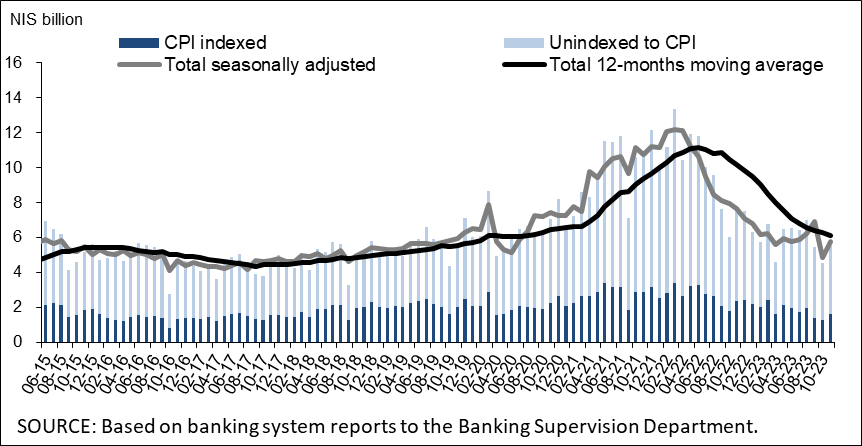
- In the third quarter of 2023, new mortgages taken out totaled about NIS 19 billion, significantly lower than in the corresponding quarter of the previous year (about NIS 27 billion). The slowdown in new mortgages continued, and they totaled about NIS 5 billion in October 2023, in view of the Swords of Iron war and seasonal adjustments—significantly lower than the monthly average of the previous three years (about NIS 8.6 billion). In November, there was a slight increase in mortgage borrowing, which totaled about NIS 6 billion seasonally adjusted, lower than in the parallel month last year (Figure 6).
Table 2: Outstanding Debt Balances of Households1
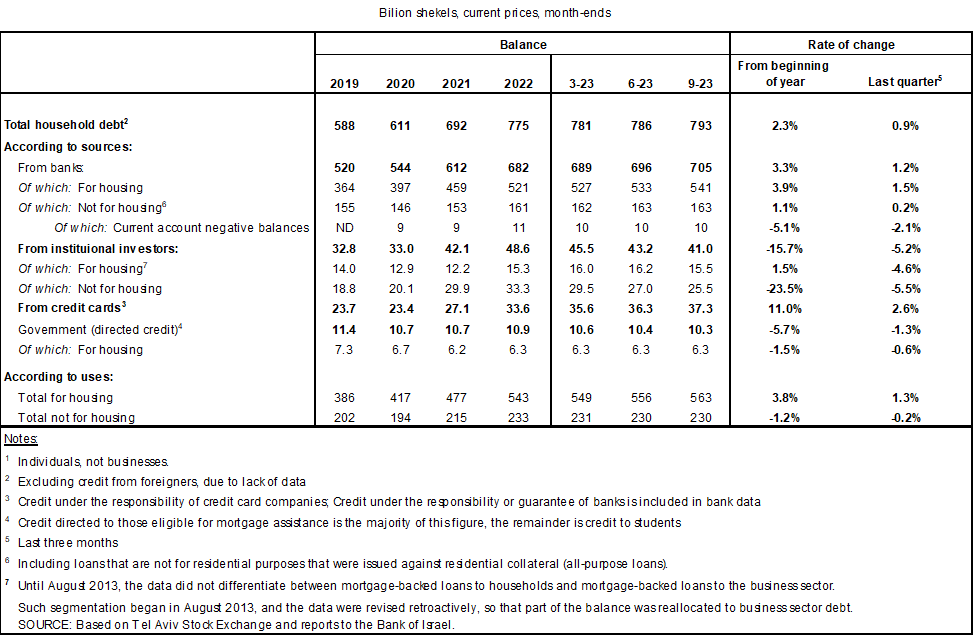
Figure 5: Rates of Change in Households’ Housing and Nonhousing Debt, Current Quarter vs. Corresponding Quarter of Previous Year
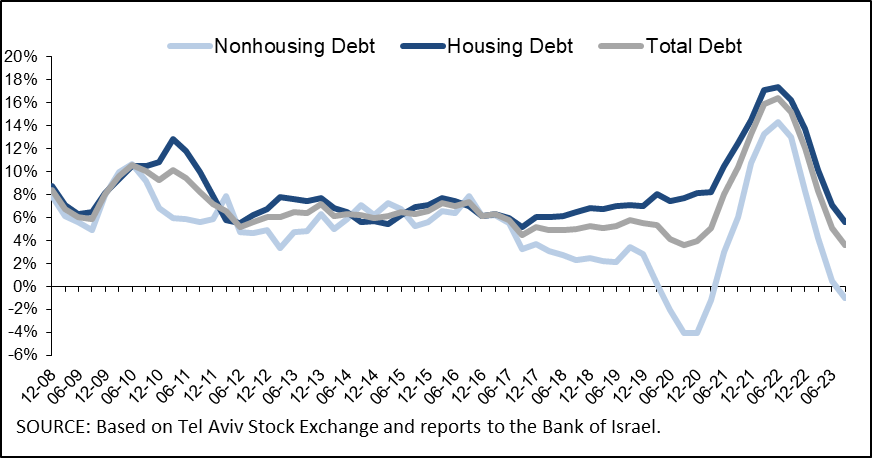
Figure 6 :Amount of New Home Purchase Loans Provided by Banks to the Public (Mortgages)
Links to Data and Statistics on the Bank of Israel website:
[1] Israeli firms, excluding banks, credit card companies, and insurance companies.
[2] CPI-indexed balances are calculated according to the CPI reading known at the time the financial statements are compiled, so the change in CPI refers to the change between the known CPI and the CPI of the preceding month.
[3] The change in the spread from one quarter to the next is calculated as the difference between the average spread in the final month of the reviewed quarter and the average spread in the final month of the previous quarter.