To view this message as a file click here
- The Exchange Rate
Weakening of the shekel alongside a mixed trend of the dollar worldwide.
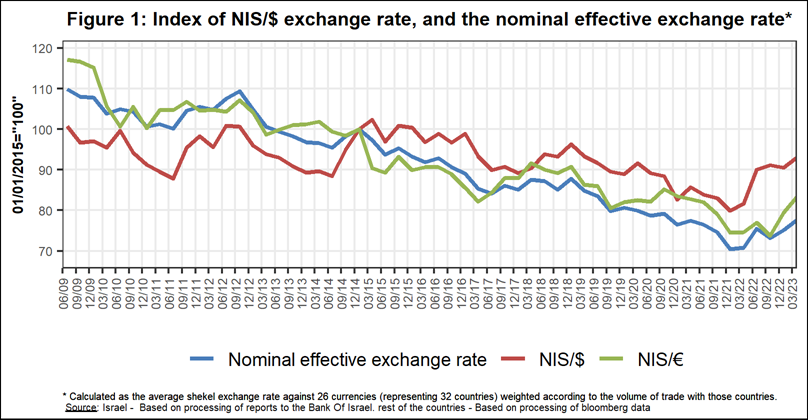
During the course of the second quarter, the shekel weakened by 2.4 percent against the dollar and by 2.2 percent against the euro.
In addition, the shekel weakened by a lower rate of about 0.1 percent against the currencies of Israel's main trading partners, in terms of the nominal effective exchange rate (i.e., the trade-weighted average shekel exchange rate against those currencies), due to the significant weakening of the Turkish lira during the quarter.
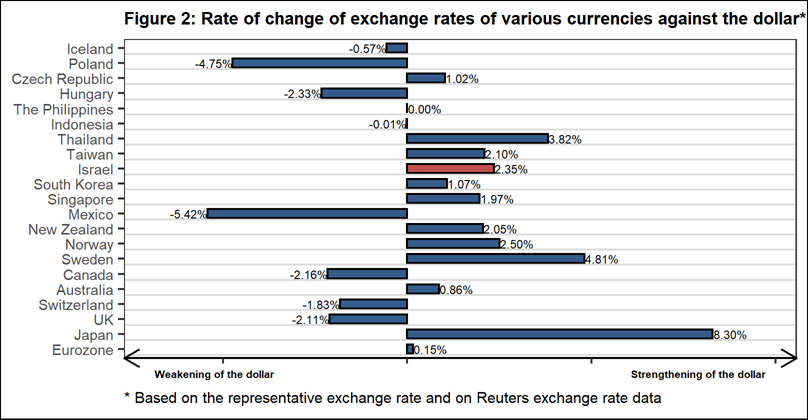
The US dollar's rate vis-à-vis major currencies (Figure 2) was mixed during the quarter. The dollar weakened by approximately 2.2 percent against the Canadian dollar and by about 2.1 percent against the British pound. In contrast, the dollar strengthened by 8.3 percent against the Japanese yen, and by about 4.8 percent against the Swedish krona.
- Exchange Rate Volatility
A decline in actual volatility and stability in implied volatility
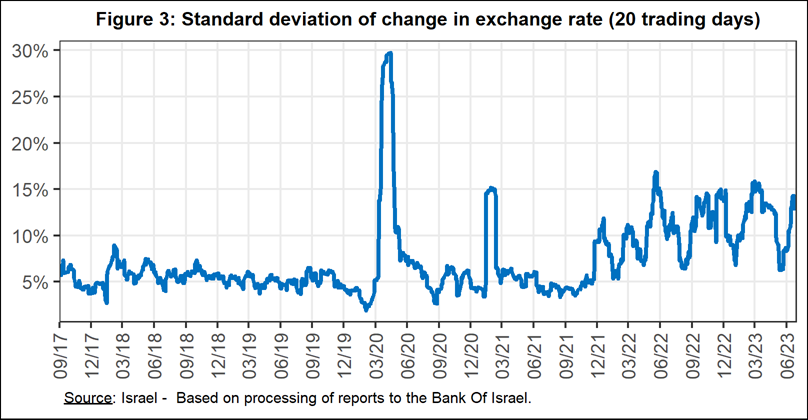
The standard deviation of changes in the shekel/dollar exchange rate, which represents its actual volatility, declined by about 1.7 percentage points during the quarter, to an average level of 10.8 percent.
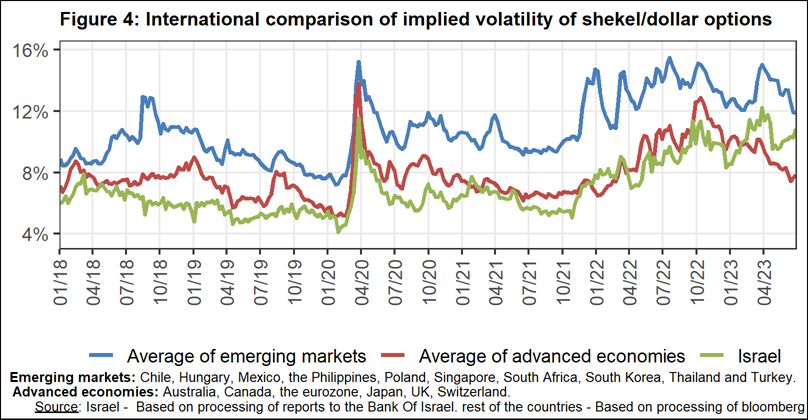
The average implied volatility in over-the-counter shekel/dollar options, an indication of expected exchange rate volatility, remained stable, at about 10.3 percent by the end of the quarter.
For comparison, the average level of implied volatility in foreign exchange options in emerging markets was 13.4 percent at the end of the quarter, an increase of 0.8 percentage points from its level at the end of the previous quarter. The average level of implied volatility in advanced-economy markets was 8.3 percent at during the quarter, a decline of about 1.6 percentage points from the previous quarter (Figure 4).
- The Activity of the Main Segments in the Foreign Exchange Market[1]
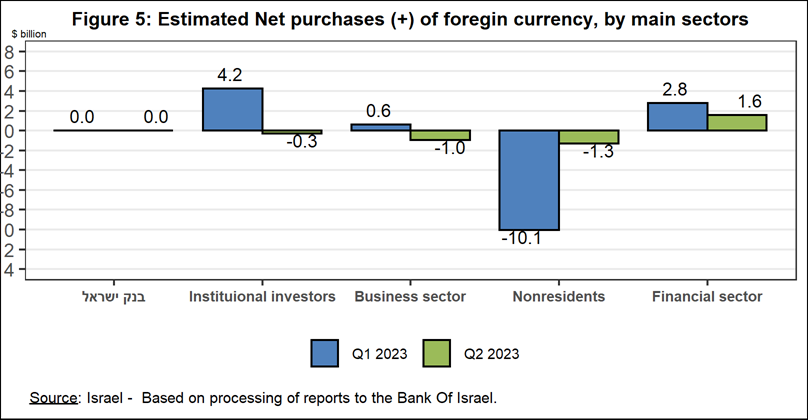
An estimate of the activity of the main segments in the foreign exchange market indicates that during the course of the first quarter, institutional investors (pension funds, provident funds, and insurance companies) and the business sector made net sales of foreign currency totaling about $0.3 billion. Nonresidents made net sales of about $1.3 billion.
[1] The main segments presented do not make up the entire market—for additional information, see the section on “The Database of Foreign Exchange Market Activity” in the Bank of Israel's "Statistical Bulletin" for 2018 (in Hebrew):
https://www.boi.org.il/he/NewsAndPublications/RegularPublications/Documents/MabatStat2018/shekel.pdf
- Trading Volume in the Foreign Currency Market—Tables and Figures
Trading volume vis-à-vis the domestic banking system[2]
The average daily trading volume declined by about 8.5 percent during the quarter to $10.2 billion, mainly due to a decline in the daily trading volume of options.
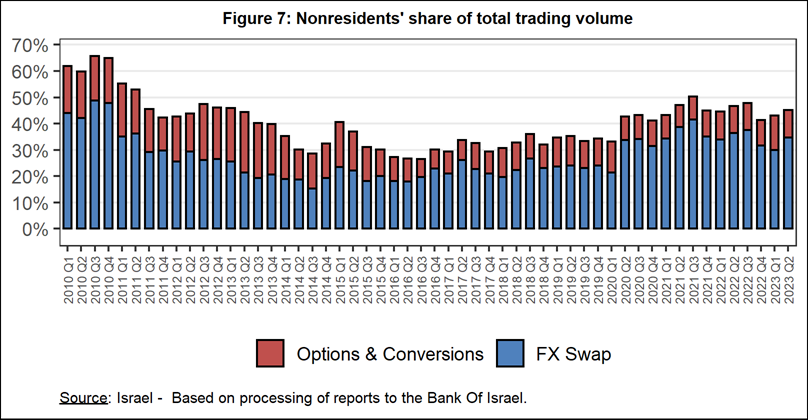
Nonresidents' share of total trading volume vis-à-vis the domestic banking system (spot and forward transactions, options, and swaps) increased by about 2.1 percent to about 45.4 percent at the end of the first quarter.
[2] From the beginning of 2020, the data do not include branches of foreign banks in Israel.

Estimated total trading volume[3]—domestic banking system and foreign reporting entities
The estimated total activity in transactions against the shekel reflected in reports from the domestic banking system and foreign reporting entities indicates that nonresidents’ relative share of trading volume in spot and forward transactions (excluding swaps and options) was 81.4 percent in the second quarter. Trade between nonresidents constituted 70.1 percent of the volume, which had a daily average of $10.5 billion.

[3] Total trading volume is an estimate of total activity in transactions against the shekel, based on reports by the domestic banking system and by foreign reporting entities.