1. The Exchange Rate
The dollar strengthened against the shekel, in parallel with strengthening of the dollar worldwide.
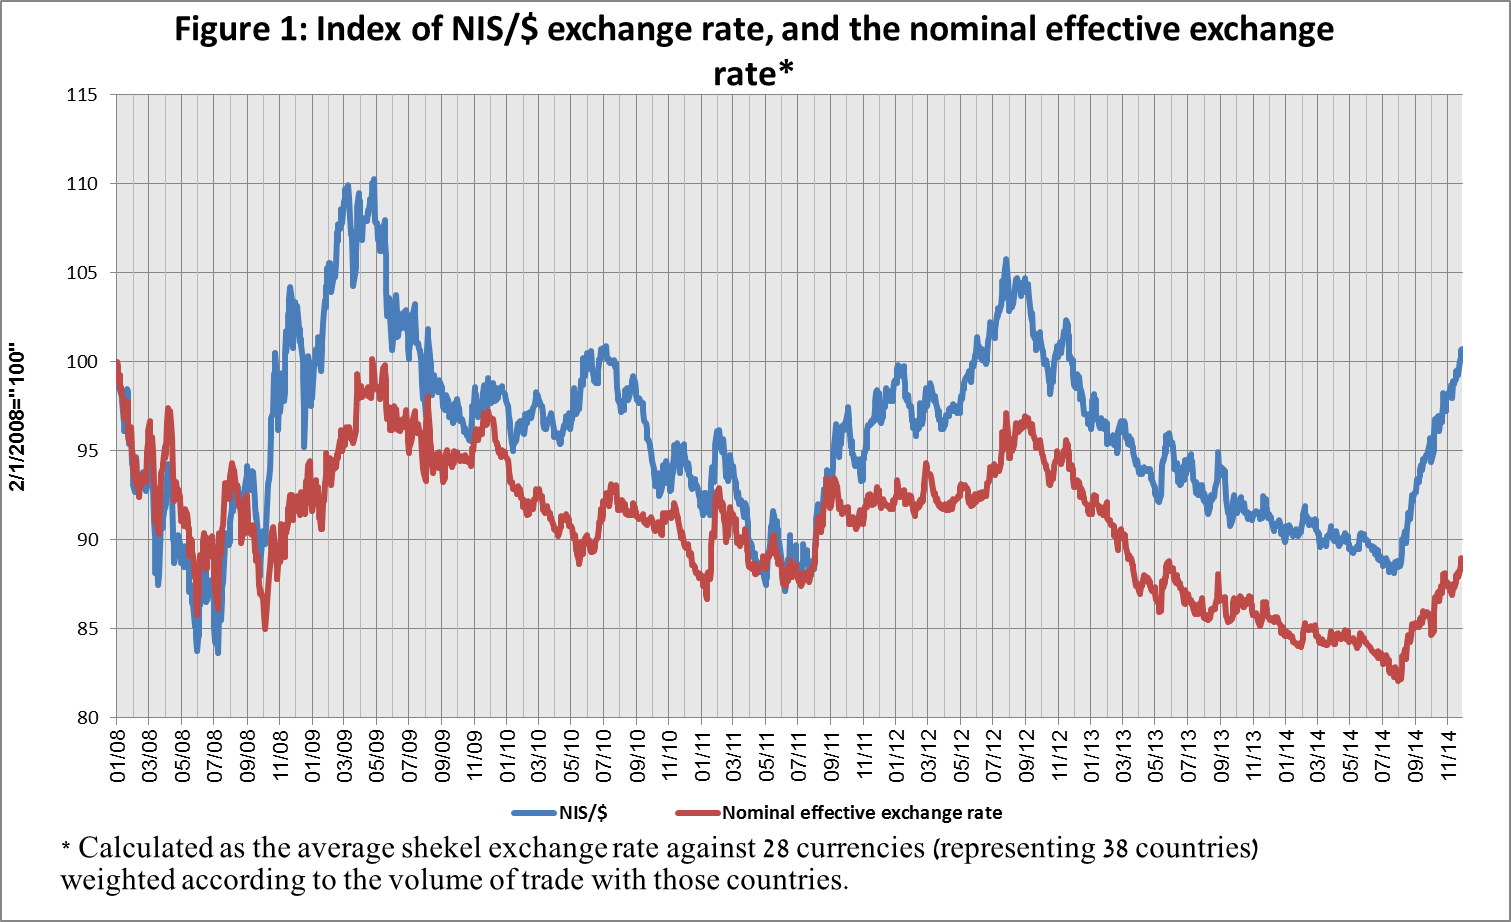
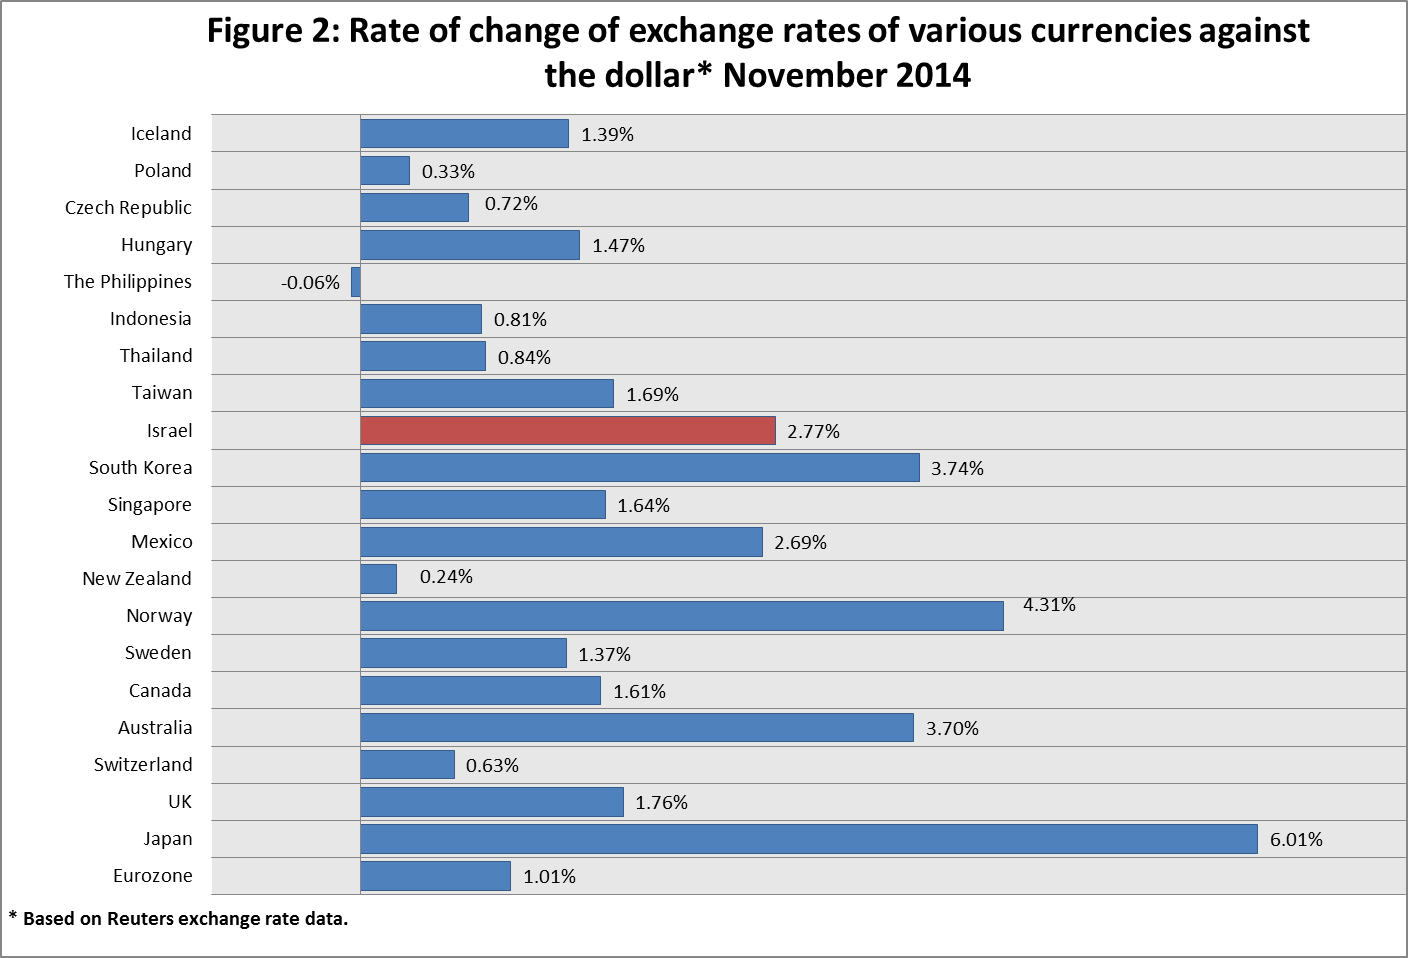
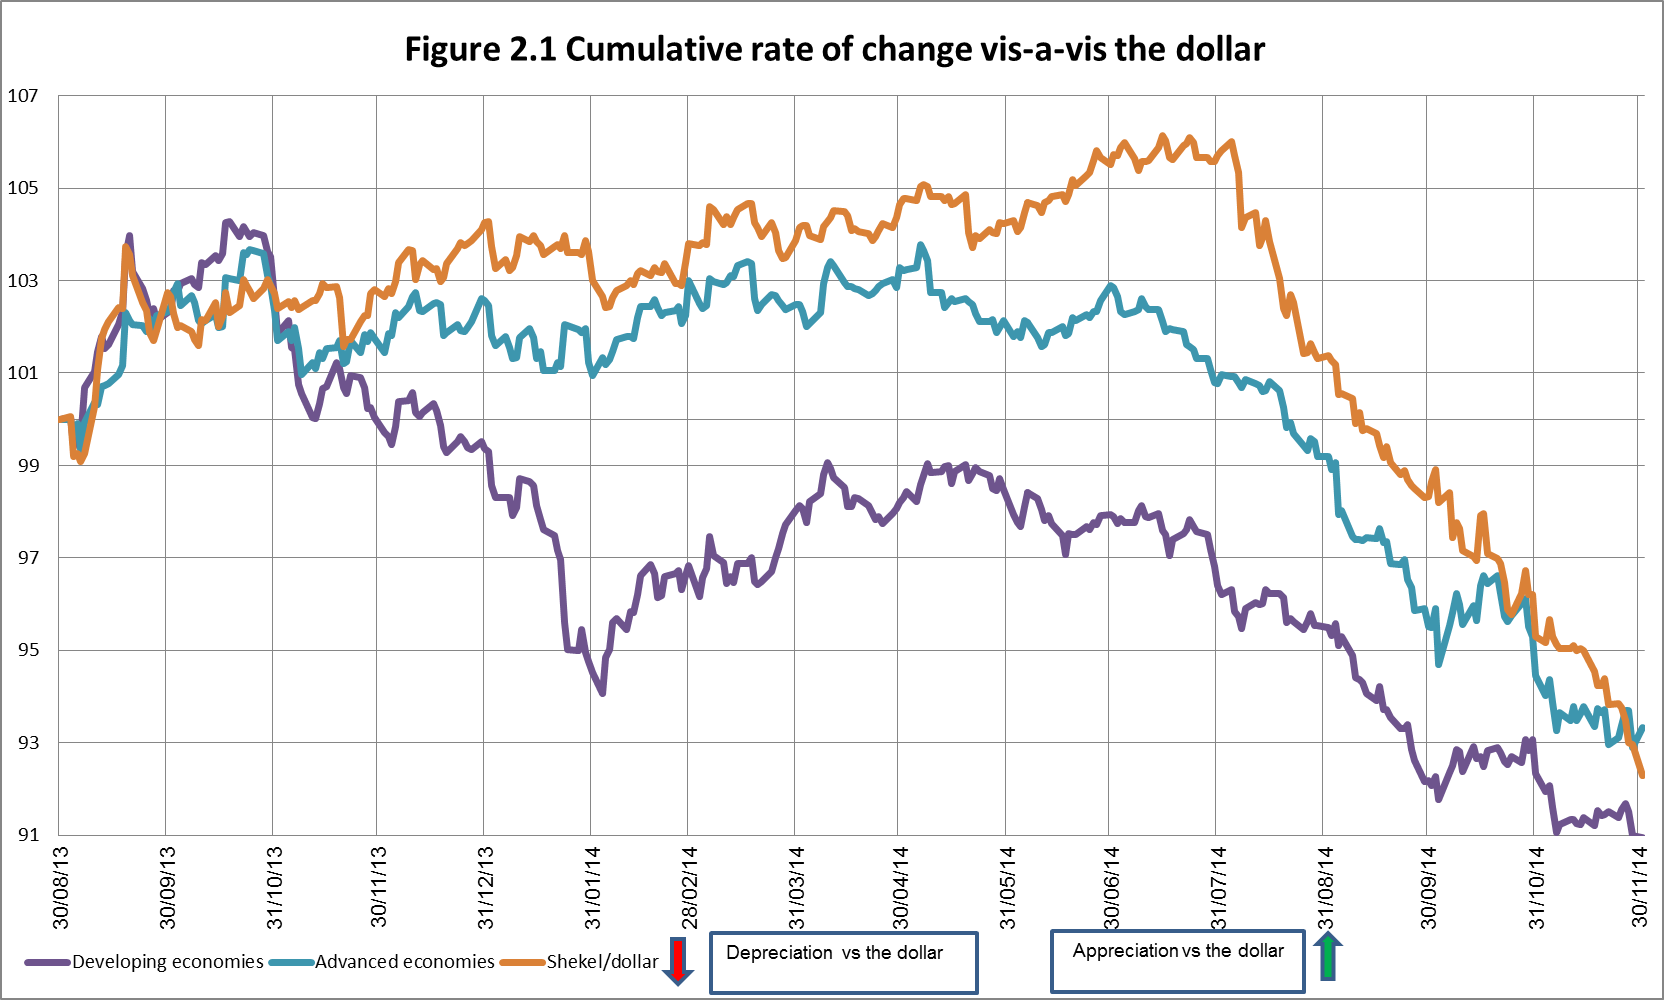
In November, the shekel weakened by about 2.8 percent against the dollar, and by about 1.7 percent against the euro. Thus, this month as well there was a continuation of the trend of depreciation of the shekel vis-à-vis the dollar, with a cumulative depreciation since the end of July of 13.4 percent.
Against the currencies of Israel's main trading partners, in terms of the nominal effective exchange rate of the shekel (i.e., the trade-weighted average shekel exchange rate against those currencies), the shekel weakened by about 1.4 percent in November, and by about 8 percent since the end of July.
Globally, the dollar strengthened in November against most currencies—including by about 1.0 percent against the euro, by about 0.6 percent against the Swiss franc, by about 1.8 percent against the British pound, and by about 6.0 percent against the Japanese yen.
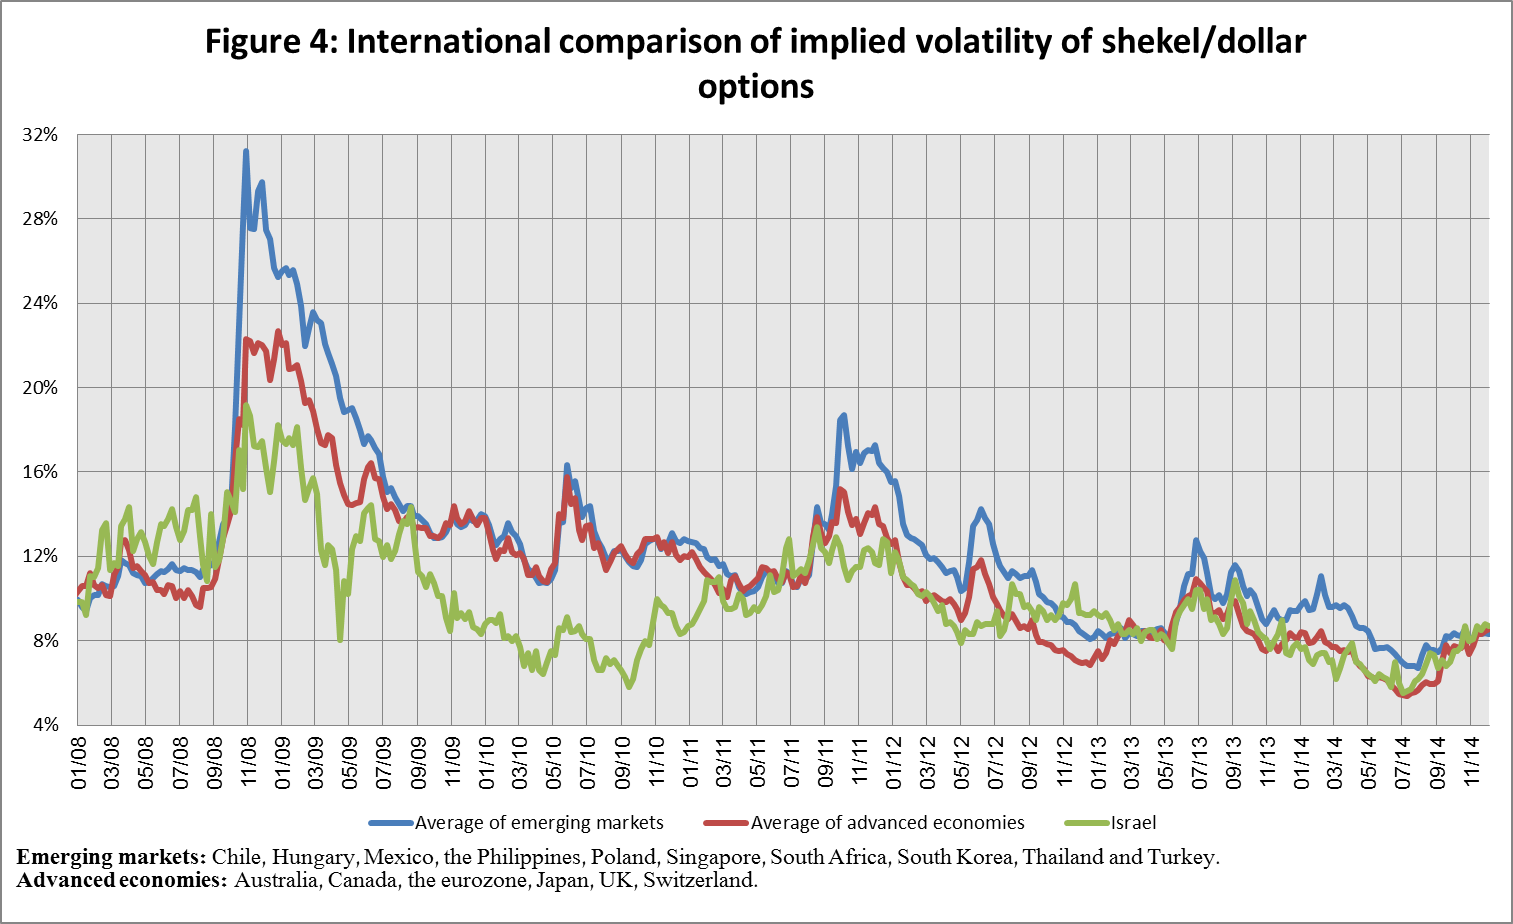
2. Exchange Rate Volatility
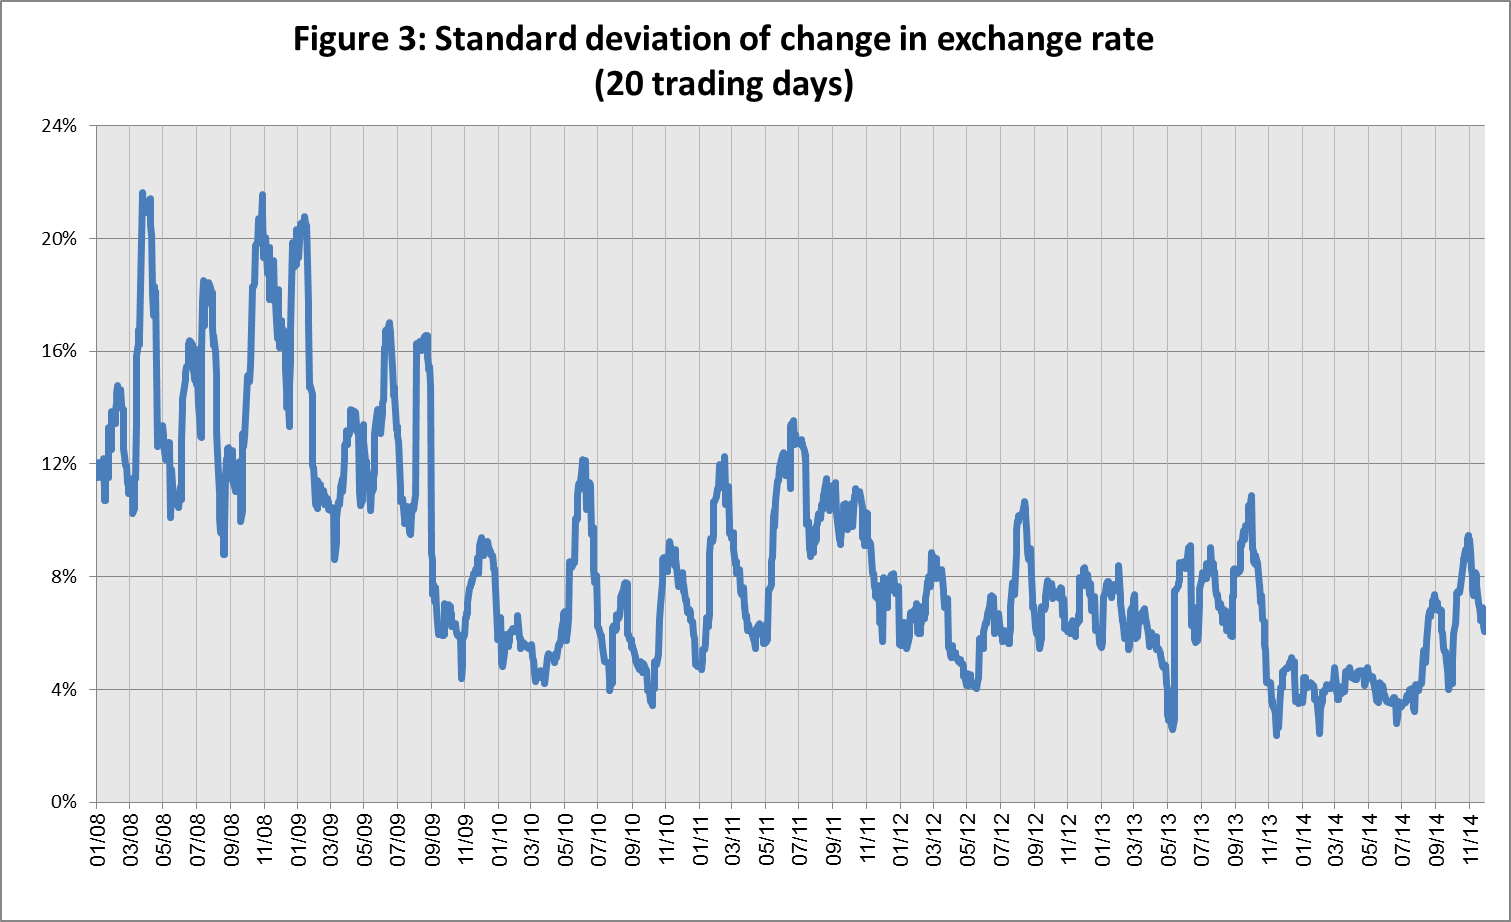
A decline in actual volatility of the exchange rate, in parallel with an increase in the implied volatility of the exchange rate.
The standard deviation of changes in the shekel-dollar exchange rate, which represents its actual volatility, declined in November by about 3 percentage points, to 6.0 percent at the end of the month.
The average level of implied volatility in over the counter shekel-dollar options––an indication of expected exchange rate volatility––increased to 8.5 percent at the end of November, compared with 7.9 percent in October.
The implied volatility in foreign exchange options in emerging markets remained unchanged, at 8.3 percent on average. In contrast, the implied volatility in foreign exchange options in advanced economies increased in November, to 8.3 percent at the end of the month (see Figure 4).
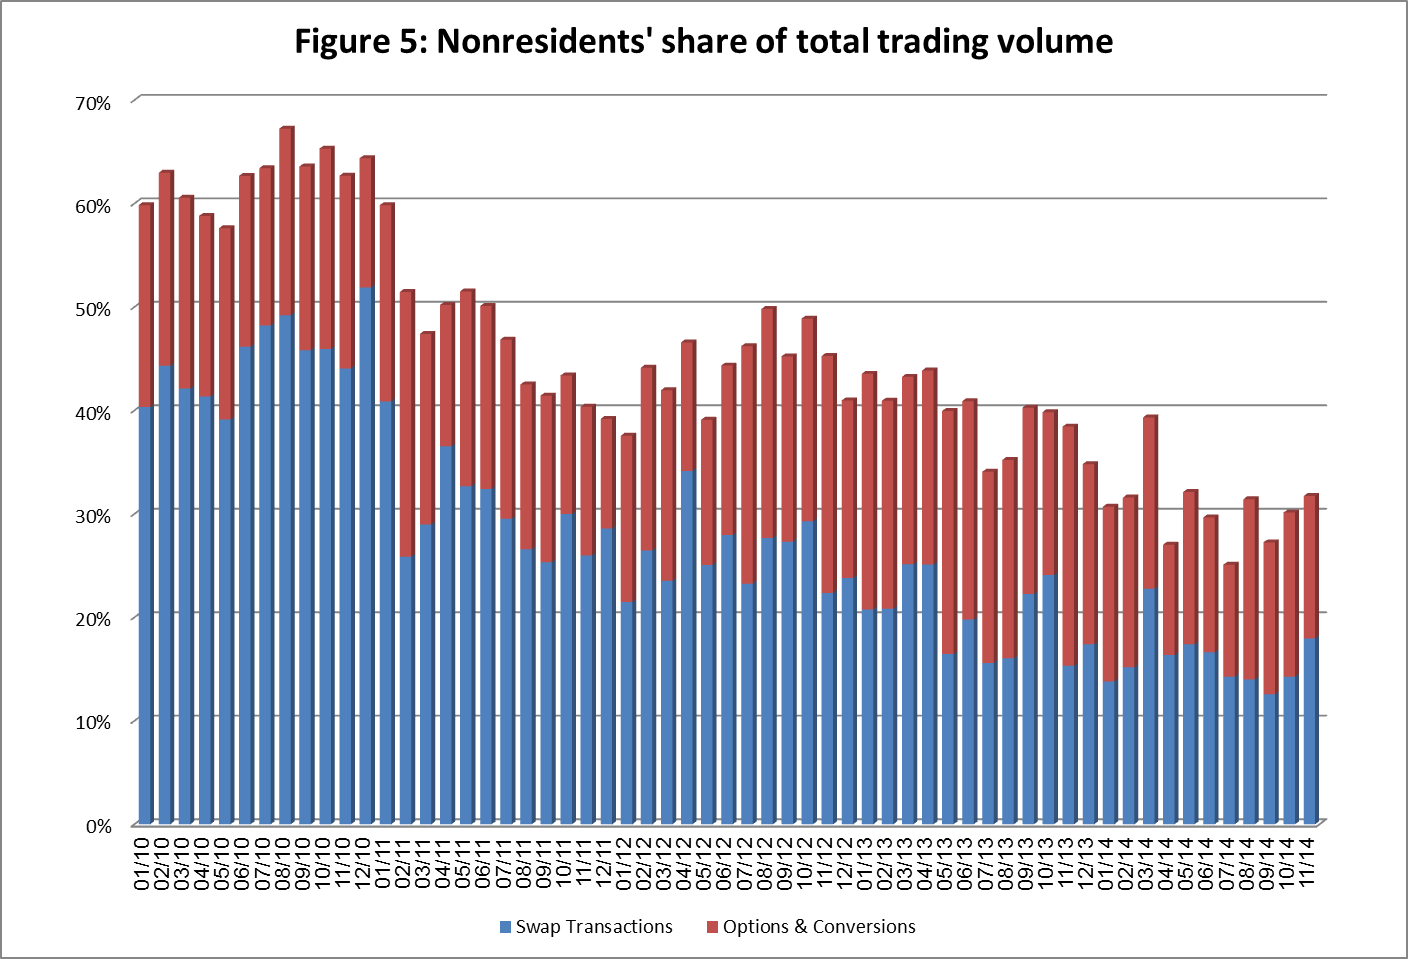
3. The Volume of Trade in the Foreign Currency Market
Total trading volume declined, and nonresidents’ share of trading volume increased.
The total volume of trade in foreign currency in November was about $137 billion, compared with about $142 billion in October. Average daily trading volume declined by about 3 percent in November, to about $6.8 billion.
The volume of trade in spot and forward transactions (conversions) was about $38 billion in November. The average daily trading volume in those transactions declined in November by about 16 percent compared with October. During November, the Bank of Israel purchased $150 million in spot and forward transactions[1], as part of the purchasing program intended to offset the effects of natural gas production on the exchange rate.
The volume of trade in over the counter foreign currency options (which are not traded on the stock exchange) totaled about $11 billion in November. The average daily trading volume in those options was about $580 million in November, virtually unchanged from October.
The trading volume of swap transactions was about $88 billion in November, compared with $85 billion in October. Average daily turnover increased by about 3 percent from the previous month, to around $4.4 billion.
Nonresidents' share of total trade (spot and forward transactions, options and swaps) increased in November, to about 32 percent, compared with about 30 percent in October (see Figure 5).
Forex transactions with domestic banks, by instruments and sectors
($ million)
Conversions (1) |
Swaps[2] (2) |
Cross Currency swap[3] (3) |
Options[4] (4) |
Total volume of trade (1)+(2)+(3)+(4) | ||
November
2014
(Not final) |
Total |
37,661 |
87,571 |
631 |
11,518 |
137,381 |
Daily average (20 days) |
1,883 |
4,379 |
32 |
576 |
6,869 | |
Nonresidents |
15,160 |
24,570 |
140 |
3,655 |
43,525 | |
of which Foreign financial institutions |
14,505 |
24,064 |
140 |
3,648 |
42,357 | |
Residents |
22,501 |
63,001 |
491 |
7,863 |
93,856 | |
of which Real sector |
6,292 |
8,353 |
202 |
3,644 |
18,491 | |
Financial sector |
5,677 |
36,269 |
89 |
2,812 |
44,847 | |
Institutions (incl. insurance companies) |
1,910 |
7,503 |
0 |
40 |
9,453 | |
Individuals and provident funds |
969 |
2,787 |
0 |
401 |
4,157 | |
The Bank of Israel |
150 |
0 |
0 |
0 |
150 | |
of which within the program to offset the gas effect |
150 |
0 |
0 |
0 |
150 | |
Other[5] |
3,040 |
18 |
0 |
119 |
3,177 | |
Domestic banks[6] |
4,463 |
8,071 |
200 |
847 |
13,581 | |
October
2014 |
Total |
44,782 |
85,164 |
848 |
11,356 |
142,150 |
Daily average (20 days) |
2,239 |
4,258 |
42 |
568 |
7,108 | |
Nonresidents |
18,426 |
20,161 |
388 |
3,986 |
42,961 | |
of which Foreign financial institutions |
17,835 |
19,017 |
388 |
3,940 |
41,180 | |
Residents |
26,356 |
65,003 |
460 |
7,370 |
99,189 | |
of which Real sector |
6,995 |
8,056 |
10 |
3,185 |
18,246 | |
Financial sector |
5,205 |
41,473 |
250 |
2,484 |
49,412 | |
Institutions (incl. insurance companies) |
4,264 |
5,288 |
0 |
75 |
9,627 | |
Individuals and provident funds |
876 |
3,777 |
0 |
437 |
5,090 | |
The Bank of Israel |
280 |
0 |
0 |
0 |
280 | |
of which within the program to offset the gas effect |
280 |
0 |
0 |
0 |
280 | |
Other4 |
3,192 |
17 |
0 |
138 |
3,347 | |
Domestic banks5 |
5,544 |
6,392 |
200 |
1,051 |
13,187 |
[1] This figure reflects transactions by trade date, not settlement date. Therefore, it is not necessarily identical to the data published in the foreign exchange reserves notice, which reflects transactions by settlement date.
[2] Only one leg of the swap, i.e., the nominal value of the transaction (in accordance with the BIS definition)
[3] The exchanged founds through Cross Currency Swap transactions considered for the volume, as one leg only in cases where the two legs offset each other.
[5] Including other entities such as portfolio managers, nonprofit organizations, national institutions, and those not include elsewhere.