A new statistical tool (“The Sentiment Index”) converts results of the Business Tendency Survey into a real time estimate of the GDP growth rate
 Full research
- A comprehensive examination of the results of the Central Bureau of Statistics Business Tendency Survey finds that changes introduced into the survey in 2016 improved the alignment of firms’ responses with quantitative data on those firms, as found in actual administrative data of the Israel Tax Authority that become available with a considerable lag.
- “The Sentiment Index” derived from the Business Tendency Survey makes it possible to forecast GDP growth in almost real time, as opposed to the lag that characterizes other tools used for this purpose.
- The growth rate estimated by “The Sentiment Index” refers to the growth trend based on activity in the principle industries, and thus is not subject to the volatility that characterizes the GDP growth rates reported by the Central Bureau of Statistics.
In 2011, the Central Bureau of Statistics (CBS) began conducting the Business Tendency Survey, sending the survey to 1,400 businesses in Israel on a monthly basis. It asks them to assess qualitatively—on a five-step scale, from “marked decrease” to “marked increase”—the changes in the past month in the company’s main indices such as output, domestic sales and export sales, employment, and prices. The survey also asks the companies about their expectations for the coming month. Such surveys, which are intended to assist policy makers to estimate the state of economic growth in real time, are very common in most advanced economies. Their advantage lies in their aggregate findings being published close to the date that the survey is conducted, and much before quantitative data on activity are available. The aggregate findings that are published by the CBS are in “net balance” form, which measures the share of companies responding with “increase” minus those that responded “decrease”. Since the CBS began conducting the survey, several notable changes have been made in it as a result of lack of satisfaction with the quality of its results.
Research conducted by Dr. Tanya Suhoy of the Bank of Israel Research Department, together with Daniel Roash from the CBS, examined the correlation of the survey’s findings with actual data regarding the activity of those companies, and the accuracy of the methodological changes made in the survey over the years. In addition, the researchers developed a statistical tool that translates the survey results into an estimate of GDP growth for the quarter in which the survey was conducted (whereas the first estimate of quarterly GDP data is only published 45 days after the end of the quarter).
The research examined the relationship between the firms’ responses and their actual quantitative data, as reported ex post to the tax authorities. This examination pointed to a statistically significant correlation in cross sections, meaning among different companies, in a given month. However, the correlation over time at the aggregate level began to be significant only from 2016, when changes were made in the questionnaire, intended to simplify it. The questions were focused on the previous month (and not on the preceding three months as had been before the change), and the requirement to adjust the answer for seasonal fluctuations was removed.
Based on the survey, the research proposes two aggregate indices for assessing the growth situation in real time. One calculates a weighted average of the per-industry net balances (specifying domestic and export sales), with weights fixed in advance based on the industry composition of business sector product (Figure 1). As an alternative, the research suggests to use as the weights variables intended to achieve the maximum correlation with GDP data. This model is based on a partial least squares regression aimed at dealing with the situation in which there are mutually correlated explanatory variables, and few observations. The method makes it possible to update the weights over time and to take into consideration the time-varying long-term growth. “The Sentiment Index” obtained on the basis of this model provides a range of real time estimates for the monthly GDP growth rates forecast by the survey’s net balances, and is found to be correlated with actual GDP growth, particularly with the initial estimates by the CBS, and with the Composite State of the Economy Index—even though the two indicators are based on different datasets Figure 2).
An out-of-sample examination of the forecast error of the quarterly growth rate via “The Sentiment Index”, beginning at the end of 2015, indicates that its forecasting ability regarding the initial growth-rate estimate is approximately equal to the now-casting model used by the Bank of Israel. “The Sentiment Index” makes it possible to make a forecast several weeks earlier due to the rapidity of the publication of the survey on which it is based. In addition, the Index makes it possible to update, over the course of the quarter, the forecast for that quarter, when new surveys are received. The research also shows that forecasting ability of the “Sentiment Index” in this test period, calculated with regard to the first estimate of GDP-growth was slightly superior to a naïve assumption of the mean growth. However, the forecasting ability of “The Sentiment Index” declines with regard to revised growth rates. This result reflects the decline that occurred, in Israel and abroad, in the GDP forecasting ability via qualitative surveys.
Figure 1
Aggregated Balance of the Business Tendency Survey1 (Left Scale) alongside the Estimated Monthly Trend2 of Monthly Business Sector Product Growth (Right scale, in annual terms), 2013:01-2019:08

1) The aggregated balance of the survey is calculated based on the net balances of the activity estimates in the surveyed industries, weighted by the industry composition of business sector product
2) Monthly GDP trend growth is calculated based on quarterly GDP data, seasonally adjusted and monthly interpolated; the range of GDP trend growth is estimated based on bootstrapping.
Figure 2
Sentiment Estimates in Real Time1 alongside the Composite State of the Economy Index (First estimate2, 2015:11–2019:08)
1) The colored lines denote different vintages of real-time estimates of the GDP growth rate for months for which quarterly official data have not yet been published.
2) 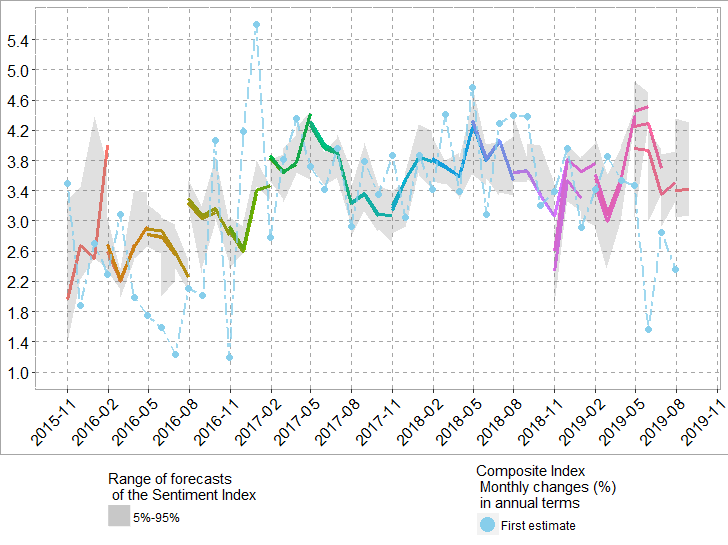
The first estimate of
the Composite State of the Economy Index is the figure published for the
reference month for the first time, before being revised due to retroactive
changes in Index components.